## Line Chart: Continual Learning Task Accuracy Evaluation
### Overview
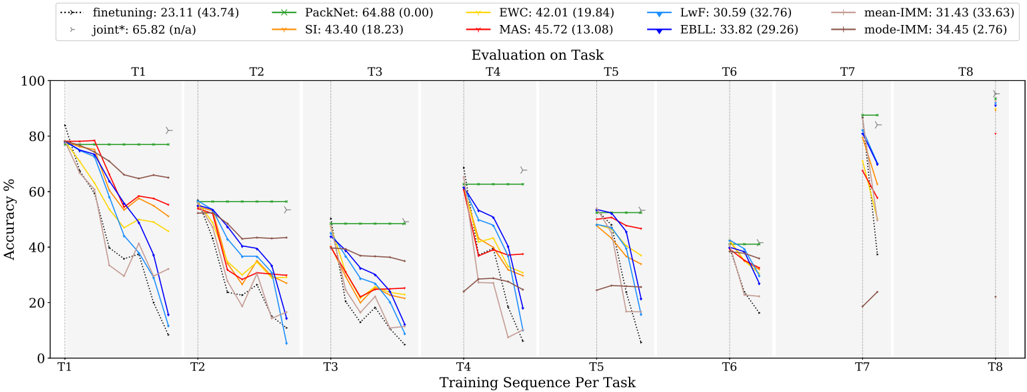
This image displays a faceted line chart comparing the performance (Accuracy %) of various continual learning algorithms across a sequence of eight tasks (T1 through T8). The chart illustrates how different models retain knowledge of previous tasks as they are trained on subsequent tasks. The X-axis represents the training sequence, while the Y-axis measures accuracy. The chart is divided into eight vertical panels, each representing the evaluation state after training on that specific task.
### Components/Axes
* **Y-Axis:** "Accuracy %", ranging from 0 to 100.
* **X-Axis:** "Training Sequence Per Task", labeled T1 through T8.
* **Legend (Top Center):** Lists the algorithms and their associated performance metrics (Average Accuracy and Standard Deviation).
| Algorithm | Line Style/Color | Metric 1 | Metric 2 |
| :--- | :--- | :--- | :--- |
| **finetuning** | Black dotted line | 23.11 | (43.74) |
| **joint*** | Grey arrow | 65.82 | (n/a) |
| **PackNet** | Green line with 'x' markers | 64.88 | (0.00) |
| **SI** | Orange line with '+' markers | 43.40 | (18.23) |
| **EWC** | Yellow line | 42.01 | (19.84) |
| **MAS** | Red line | 45.72 | (13.08) |
| **LwF** | Light Blue line | 30.59 | (32.76) |
| **EBLL** | Dark Blue line with triangle markers | 33.82 | (29.26) |
| **mean-IMM** | Pink/Light Red line with '+' markers | 31.43 | (33.63) |
| **mode-IMM** | Brown line with '+' markers | 34.45 | (2.76) |
### Detailed Analysis
The chart is segmented into eight panels (T1-T8). Each panel shows the accuracy of the models on the tasks learned *up to that point*.
* **T1 Panel:** All models begin with high accuracy, clustering around 80%. `finetuning` (black dotted) shows the steepest decline as the sequence progresses within this panel.
* **T2 Panel:** `PackNet` (green) maintains a flat, high accuracy (~55%). All other models show a downward trend, with `finetuning` dropping the lowest.
* **T3 Panel:** `PackNet` remains stable at ~48%. The other models continue to show degradation, with `finetuning` and `LwF` (light blue) showing the most significant drops.
* **T4 Panel:** `PackNet` remains stable at ~62%. `finetuning` drops sharply to near 0%.
* **T5 Panel:** `PackNet` remains stable at ~52%. Other models show varying degrees of degradation, with `MAS` (red) and `EWC` (yellow) performing slightly better than the others.
* **T6 Panel:** `PackNet` remains stable at ~40%. The other models are clustered between 20% and 40%.
* **T7 Panel:** Only `PackNet` and `joint*` (grey arrow) are visible at high accuracy levels (~80%). Most other models have dropped significantly.
* **T8 Panel:** Only the `joint*` benchmark is visible at the top (~95%).
### Key Observations
* **Catastrophic Forgetting:** The `finetuning` method (black dotted line) exhibits the most severe "catastrophic forgetting," where accuracy drops precipitously as new tasks are introduced.
* **PackNet Stability:** `PackNet` (green) is the clear outlier in terms of stability. It maintains a nearly flat line across all panels, indicating it does not suffer from catastrophic forgetting. This is likely due to its architectural approach (parameter isolation/masking).
* **The `joint*` Benchmark:** The `joint*` (grey arrow) represents the theoretical upper bound, as it is trained on all data simultaneously. It consistently sits at the top of the performance range.
* **Performance Clustering:** Most regularization-based methods (EWC, SI, MAS, LwF, IMM variants) cluster in the middle-to-lower performance range, showing a clear downward trend in accuracy as the task sequence increases.
### Interpretation
This chart is a classic visualization of the "Stability-Plasticity Dilemma" in machine learning.
* **What the data demonstrates:** It shows that standard `finetuning` is insufficient for continual learning because the model overwrites weights learned for previous tasks to accommodate new ones.
* **Why it matters:** The chart highlights that architectural approaches like `PackNet` (which likely freezes weights or uses masks to protect previous knowledge) are far more effective at retaining performance than regularization-based methods (like EWC or SI) which attempt to constrain weight updates.
* **Reading between the lines:** The `PackNet` line being perfectly flat suggests it is effectively partitioning the network capacity for each task. While this solves the forgetting problem, it implies that the model capacity is finite; eventually, `PackNet` would run out of parameters to allocate to new tasks, whereas the other methods might continue to learn (albeit with forgetting). The `joint*` benchmark serves as the "gold standard" that other methods strive to approach.