\n
## Line Chart: Accuracy vs. Training Sequence Per Task
### Overview
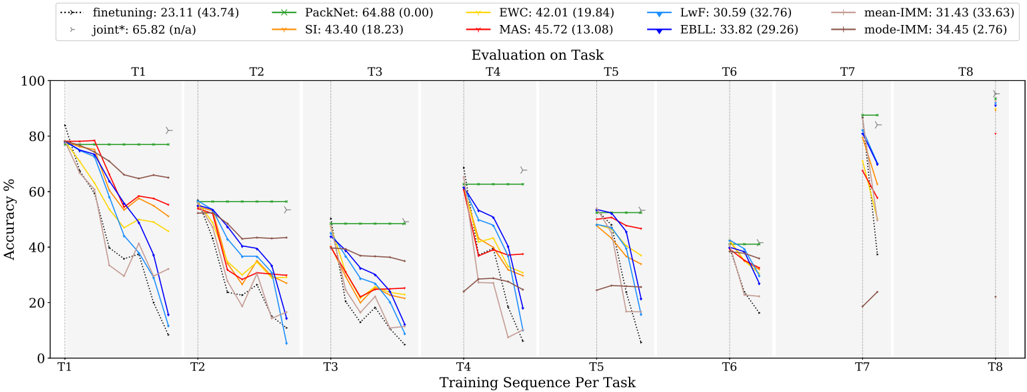
This line chart depicts the accuracy performance of several machine learning algorithms across eight tasks (T1-T8) as the training sequence progresses. The y-axis represents accuracy in percentage, while the x-axis represents the training sequence per task. Each line represents a different algorithm, and the chart includes standard deviation markers (vertical lines) to indicate the variability in performance. The chart also includes the mean and standard deviation of the accuracy for each algorithm.
### Components/Axes
* **X-axis:** "Training Sequence Per Task" with markers T1, T2, T3, T4, T5, T6, T7, and T8.
* **Y-axis:** "Accuracy %" ranging from 0 to 100.
* **Legend (Top-Center):** Contains the names of the algorithms and their corresponding mean accuracy (standard deviation).
* finetuning: 23.11 (43.74) - Dashed Blue Line
* PackNet: 64.88 (0.00) - Solid Green Line
* EWC: 42.01 (19.84) - Solid Orange Line
* LwF: 30.59 (32.76) - Solid Cyan Line
* MAS: 45.72 (13.08) - Dashed Red Line
* EBLL: 33.82 (29.26) - Dashed Magenta Line
* mean-IMM: 31.43 (33.63) - Solid Gray Line
* mode-IMM: 34.45 (2.76) - Solid Dark Green Line
* joint*: 65.82 (n/a) - Dashed Dark Green Line
* SI: 43.40 (18.23) - Dashed Yellow Line
* **Title (Center-Top):** "Evaluation on Task"
### Detailed Analysis
The chart shows the accuracy of each algorithm as it is trained on successive tasks. The vertical lines represent the standard deviation around the mean accuracy at each task.
* **PackNet (Green):** Starts at approximately 80% accuracy at T1 and remains relatively stable around 60-70% through T8. The standard deviation is very low (0.00).
* **joint* (Dark Green):** Starts at approximately 75% accuracy at T1 and declines to around 50% by T8.
* **finetuning (Blue):** Starts at approximately 75% accuracy at T1 and declines rapidly to around 10% by T8.
* **EWC (Orange):** Starts at approximately 65% accuracy at T1 and declines to around 20% by T8.
* **MAS (Red):** Starts at approximately 70% accuracy at T1 and declines to around 20% by T8.
* **EBLL (Magenta):** Starts at approximately 60% accuracy at T1 and declines to around 10% by T8.
* **LwF (Cyan):** Starts at approximately 50% accuracy at T1 and declines to around 10% by T8.
* **SI (Yellow):** Starts at approximately 65% accuracy at T1 and declines to around 20% by T8.
* **mean-IMM (Gray):** Starts at approximately 50% accuracy at T1 and declines to around 10% by T8.
* **mode-IMM (Dark Green):** Starts at approximately 50% accuracy at T1 and declines to around 30% by T8.
**Specific Data Points (Approximate):**
| Algorithm | T1 (%) | T2 (%) | T3 (%) | T4 (%) | T5 (%) | T6 (%) | T7 (%) | T8 (%) |
|--------------|--------|--------|--------|--------|--------|--------|--------|--------|
| finetuning | 75 | 60 | 40 | 20 | 10 | 10 | 10 | 10 |
| PackNet | 80 | 70 | 65 | 60 | 60 | 60 | 60 | 60 |
| EWC | 65 | 50 | 40 | 30 | 25 | 20 | 20 | 20 |
| LwF | 50 | 40 | 30 | 20 | 15 | 15 | 10 | 10 |
| MAS | 70 | 55 | 40 | 30 | 20 | 20 | 20 | 20 |
| EBLL | 60 | 45 | 30 | 20 | 15 | 15 | 10 | 10 |
| mean-IMM | 50 | 40 | 30 | 20 | 15 | 15 | 10 | 10 |
| mode-IMM | 50 | 45 | 40 | 35 | 30 | 30 | 30 | 30 |
| joint* | 75 | 65 | 55 | 50 | 45 | 40 | 35 | 30 |
| SI | 65 | 50 | 40 | 30 | 25 | 20 | 20 | 20 |
### Key Observations
* PackNet consistently exhibits the highest accuracy across all tasks, with minimal performance degradation.
* Finetuning, EWC, MAS, EBLL, LwF, mean-IMM, and SI show a significant decline in accuracy as the number of tasks increases, indicating catastrophic forgetting.
* mode-IMM shows a more stable performance compared to the other algorithms, but still experiences some decline.
* The standard deviation markers indicate that PackNet has the most consistent performance, while others have more variability.
### Interpretation
The chart demonstrates the impact of continual learning on different machine learning algorithms. Algorithms like finetuning, EWC, MAS, EBLL, LwF, mean-IMM, and SI suffer from catastrophic forgetting – the tendency to lose previously learned information when learning new tasks. PackNet, with its low standard deviation and stable performance, appears to be more robust to catastrophic forgetting. The "Evaluation on Task" title suggests that the accuracy is being measured on the tasks themselves, rather than on a separate validation set. The joint* algorithm performs well initially but degrades similarly to the other algorithms. The inclusion of mean-IMM and mode-IMM suggests an investigation into the impact of different averaging strategies within an incremental moment matching (IMM) framework. The n/a standard deviation for joint* may indicate that the standard deviation was not calculated or is not available for this algorithm. The chart highlights the importance of developing algorithms that can effectively learn new tasks without forgetting previously learned ones.