## Line Graph: Evaluation on Task
### Overview
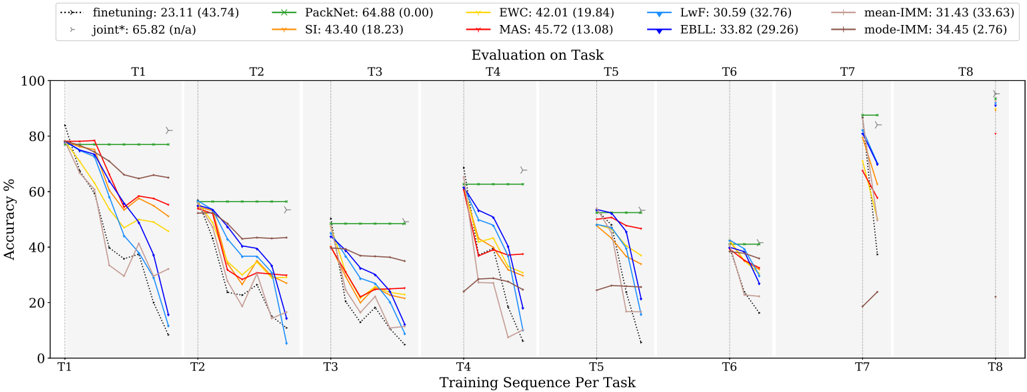
The image is a multi-line graph comparing the accuracy performance of various machine learning methods across eight sequential tasks (T1–T8). The y-axis represents accuracy percentage (0–100%), and the x-axis represents training sequences per task. The graph includes eight distinct data series, each represented by a unique color and marker, with a legend in the top-left corner. Key trends show significant performance decay for most methods over time, with one method maintaining near-constant high performance.
### Components/Axes
- **X-axis**: "Training Sequence Per Task" (T1 to T8)
- **Y-axis**: "Accuracy %" (0–100%)
- **Legend**: Located in the top-left corner, listing:
- PackNet (green dashed line with 'x' markers)
- EWC (orange solid line with '+' markers)
- MAS (red solid line with 'o' markers)
- LwF (blue solid line with '▼' markers)
- EBLL (purple solid line with '▲' markers)
- Finetuning (black dotted line with '▶' markers)
- Joint* (gray dashed line with '▶' markers)
- mean-IMM (brown dashed line with '▶' markers)
- mode-IMM (dark brown dashed line with '▶' markers)
- **Task Labels**: T1–T8 positioned below the x-axis.
### Detailed Analysis
1. **PackNet (Green)**:
- Starts at 64.88% (T1) and remains relatively stable, with minor fluctuations (e.g., 58.32% at T2, 55.11% at T3).
- Maintains the highest accuracy across all tasks, ending at 64.88% (T8).
2. **EWC (Orange)**:
- Begins at 42.01% (T1), peaks at 45.72% (T3), then declines to 30.59% (T8).
3. **MAS (Red)**:
- Starts at 45.72% (T1), drops to 33.82% (T4), and stabilizes around 31.43% (T8).
4. **LwF (Blue)**:
- Declines sharply from 30.59% (T1) to 18.23% (T8), with significant drops at T4 and T6.
5. **EBLL (Purple)**:
- Starts at 33.82% (T1), declines to 29.26% (T8), with a notable dip at T5.
6. **Finetuning (Black Dotted)**:
- Peaks at 23.11% (T1), drops to 13.08% (T8), with erratic fluctuations.
7. **Joint* (Gray Dashed)**:
- Starts at 65.82% (T1), declines to 34.45% (T8), with sharp drops at T4 and T7.
8. **mean-IMM (Brown Dashed)**:
- Starts at 31.43% (T1), declines to 27.63% (T8), with minor fluctuations.
9. **mode-IMM (Dark Brown Dashed)**:
- Starts at 34.45% (T1), declines to 27.63% (T8), with a sharp drop at T6.
### Key Observations
- **PackNet** consistently outperforms all other methods, maintaining near-constant accuracy (64.88% ± 0.00) across all tasks.
- **LwF** and **Finetuning** exhibit the steepest declines, suggesting poor generalization to new tasks.
- **Joint*** and **EWC** show moderate decay but retain higher accuracy than most methods after T4.
- **mean-IMM** and **mode-IMM** demonstrate gradual declines, with mode-IMM outperforming mean-IMM slightly in later tasks.
- **MAS** and **EBLL** show intermediate performance, with MAS declining more sharply than EBLL.
### Interpretation
The data suggests that **PackNet** is the most robust method for sequential task learning, maintaining high accuracy without significant decay. This implies superior generalization capabilities compared to other methods. In contrast, **LwF** and **Finetuning** suffer from catastrophic forgetting, as their accuracy drops sharply with each new task. The **Joint*** method, while initially high-performing, also shows substantial decay, indicating potential limitations in handling task sequences. The **mean-IMM** and **mode-IMM** methods, while less effective than PackNet, demonstrate more stability than LwF or Finetuning, suggesting they may balance adaptation and retention better. The consistent performance of PackNet across all tasks highlights its effectiveness in mitigating catastrophic forgetting, a critical challenge in continual learning scenarios.