## Horizontal Bar Chart: Performance Comparison on FB15k-237 Dataset
### Overview
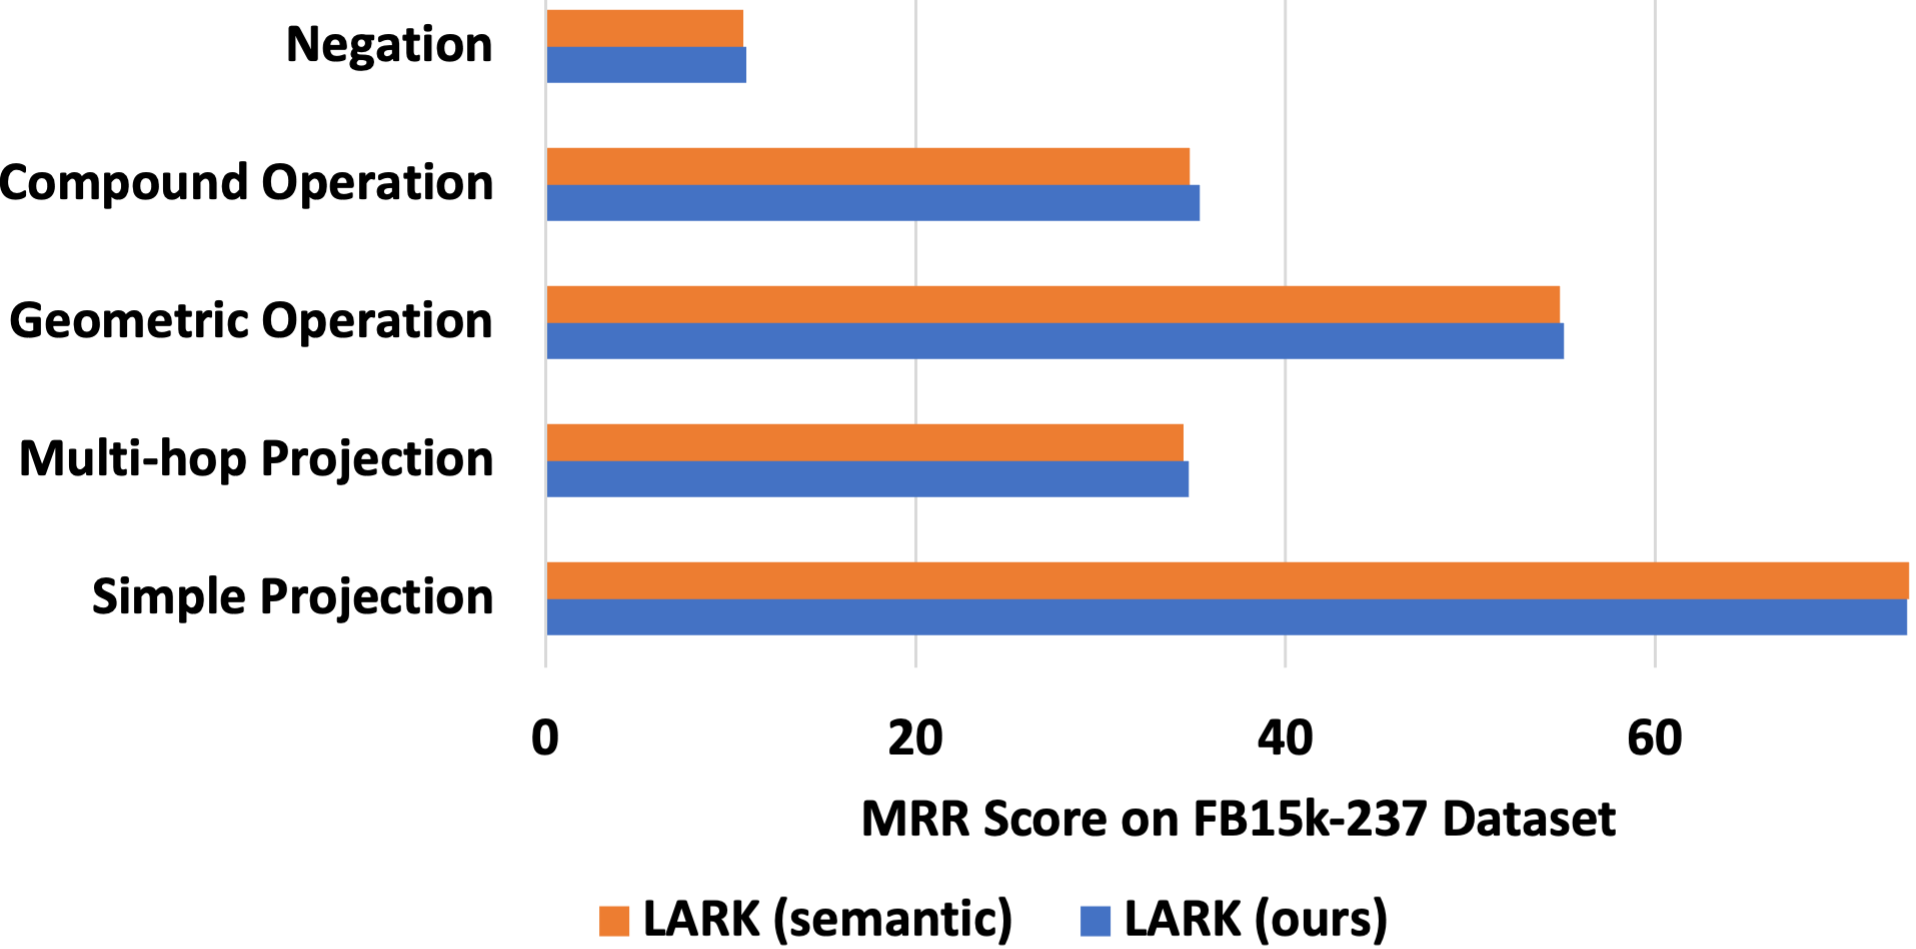
This image displays a horizontal bar chart comparing the performance of two models or methods, labeled "LARK (semantic)" and "LARK (ours)", across five distinct reasoning or operation categories. The performance metric is the Mean Reciprocal Rank (MRR) score on the FB15k-237 dataset, a common benchmark for knowledge graph completion tasks.
### Components/Axes
* **Chart Type:** Horizontal grouped bar chart.
* **Y-Axis (Vertical):** Lists five categorical variables representing different types of operations or reasoning tasks. From top to bottom:
1. Negation
2. Compound Operation
3. Geometric Operation
4. Multi-hop Projection
5. Simple Projection
* **X-Axis (Horizontal):** Represents the quantitative metric, labeled **"MRR Score on FB15k-237 Dataset"**. The axis has major tick marks at 0, 20, 40, and 60.
* **Legend:** Positioned at the bottom center of the chart. It defines the two data series:
* **Orange Square:** LARK (semantic)
* **Blue Square:** LARK (ours)
* **Data Series:** For each category on the Y-axis, there are two bars placed side-by-side (grouped). The top bar in each group is orange, and the bottom bar is blue.
### Detailed Analysis
The chart presents the following approximate MRR scores for each category. Values are estimated based on bar length relative to the x-axis scale.
1. **Negation:**
* **Trend:** Both bars are the shortest on the chart, indicating the lowest performance for this task.
* **LARK (semantic) [Orange]:** ~10
* **LARK (ours) [Blue]:** ~10 (appears equal to or very slightly longer than the orange bar).
2. **Compound Operation:**
* **Trend:** Moderate performance, with both bars extending to a similar length.
* **LARK (semantic) [Orange]:** ~35
* **LARK (ours) [Blue]:** ~36 (appears marginally longer than the orange bar).
3. **Geometric Operation:**
* **Trend:** High performance for both methods, representing the second-highest scores on the chart.
* **LARK (semantic) [Orange]:** ~55
* **LARK (ours) [Blue]:** ~56 (appears slightly longer than the orange bar).
4. **Multi-hop Projection:**
* **Trend:** Moderate performance, very similar in magnitude to "Compound Operation."
* **LARK (semantic) [Orange]:** ~35
* **LARK (ours) [Blue]:** ~35 (bars appear nearly identical in length).
5. **Simple Projection:**
* **Trend:** The highest performance category for both methods, with the longest bars on the chart.
* **LARK (semantic) [Orange]:** ~65 (extends slightly past the 60 mark).
* **LARK (ours) [Blue]:** ~64 (appears very slightly shorter than the orange bar).
### Key Observations
* **Performance Hierarchy:** There is a clear hierarchy of task difficulty as measured by MRR score: Simple Projection > Geometric Operation > Compound Operation ≈ Multi-hop Projection > Negation.
* **Model Comparison:** The performance of "LARK (ours)" and "LARK (semantic)" is extremely close across all five categories. The differences are minimal, often appearing as slight leads for one method or the other within a single point.
* **Notable Anomaly:** The "Simple Projection" category is the only one where "LARK (semantic)" (orange) appears to have a slight but visible performance advantage over "LARK (ours)" (blue). In all other categories, "LARK (ours)" is either equal or marginally better.
* **Consistency:** Both methods show a consistent pattern of strengths and weaknesses across the different operation types.
### Interpretation
This chart is likely from a research paper or technical report evaluating a new model variant ("LARK (ours)") against a baseline or alternative version ("LARK (semantic)"). The FB15k-237 dataset is a standard benchmark for evaluating knowledge graph embedding models on link prediction tasks.
The data suggests that the modifications or approach taken in "LARK (ours)" yield performance that is highly comparable to the "semantic" version across a diverse set of reasoning operations. The near-identical scores imply that the core capability for these specific tasks is preserved. The slight underperformance on "Simple Projection" could be a minor trade-off for potential gains elsewhere (e.g., computational efficiency, performance on other datasets, or robustness), which would need to be examined in the broader context of the full study. The consistently low scores for "Negation" highlight this as a particularly challenging reasoning type for both model variants, a common finding in knowledge graph completion research. The chart effectively communicates that the new method maintains state-of-the-art level performance across a taxonomy of complex queries.