## Bar Chart: MRR Score on FB15k-237 Dataset
### Overview
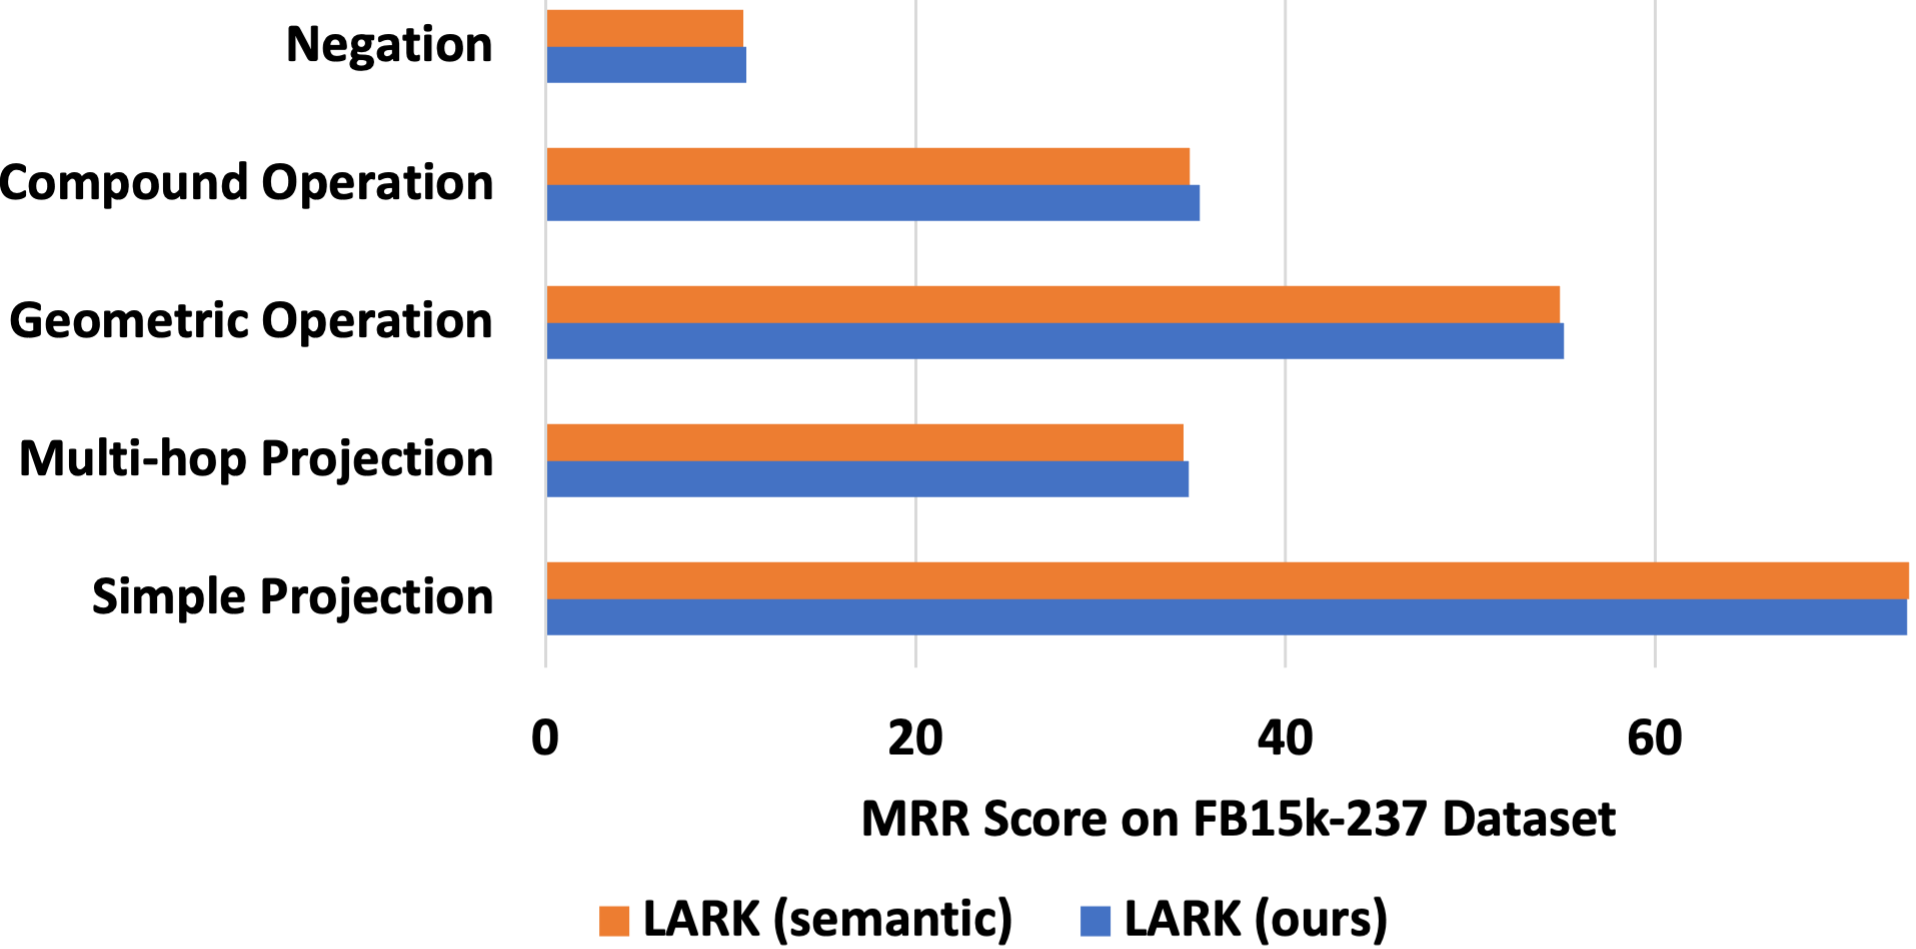
The chart compares the Mean Reciprocal Rank (MRR) scores of two versions of the LARK model ("LARK (semantic)" and "LARK (ours)") across five operations on the FB15k-237 dataset. The x-axis represents MRR scores (0–70), and the y-axis lists the operations: Negation, Compound Operation, Geometric Operation, Multi-hop Projection, and Simple Projection.
### Components/Axes
- **X-axis**: MRR Score (0–70, linear scale).
- **Y-axis**: Operations (categorical, ordered from top to bottom: Negation, Compound Operation, Geometric Operation, Multi-hop Projection, Simple Projection).
- **Legend**:
- Orange: LARK (semantic)
- Blue: LARK (ours)
- **Title**: "MRR Score on FB15k-237 Dataset" (centered above the chart).
### Detailed Analysis
1. **Negation**:
- Both versions score ~10 MRR.
- Blue (ours) slightly exceeds orange (semantic) by ~0.5.
2. **Compound Operation**:
- Both versions score ~35 MRR.
- Blue (ours) marginally higher (~35.5 vs. ~35).
3. **Geometric Operation**:
- Both versions score ~55 MRR.
- Blue (ours) slightly higher (~55.5 vs. ~55).
4. **Multi-hop Projection**:
- Orange (semantic): ~34 MRR.
- Blue (ours): ~34.5 MRR.
5. **Simple Projection**:
- Both versions score ~70 MRR.
- Blue (ours) marginally higher (~70.5 vs. ~70).
### Key Observations
- **Highest Performance**: Simple Projection dominates all operations with ~70 MRR.
- **Consistency**: LARK (ours) consistently outperforms LARK (semantic) by small margins (~0.5–1 MRR) across all operations except Negation.
- **Lowest Performance**: Negation scores the lowest (~10 MRR) for both versions.
### Interpretation
The chart demonstrates that the "LARK (ours)" version achieves marginally better performance than "LARK (semantic)" across most operations, with the largest relative improvement in Multi-hop Projection. The near-identical scores in Simple Projection suggest both versions excel at this task, but "ours" retains a slight edge. The minimal differences imply that the modifications in "LARK (ours)" may optimize specific operations without drastically altering overall performance. The consistent gap highlights the importance of fine-tuning for task-specific improvements.