## Diagram: Multi-Label Classification and Segmentation Model Training
### Overview
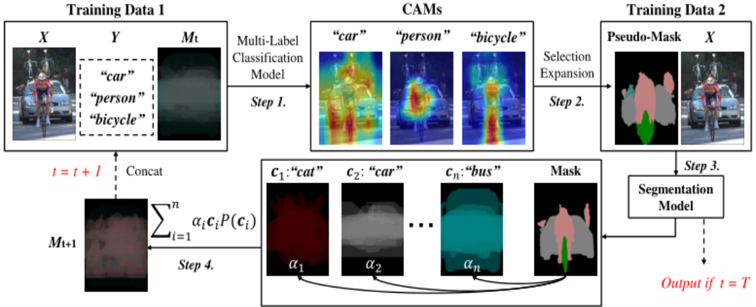
The image is a diagram illustrating a multi-label classification and segmentation model training process. It shows the flow of data through different steps, including multi-label classification, class activation map (CAM) generation, selection expansion, and segmentation model training. The diagram uses two sets of training data and iteratively refines a mask.
### Components/Axes
* **Training Data 1:** Contains input image (X), labels (Y), and a mask (Mt).
* **X:** An image showing a person on a bicycle, a car, and other background elements.
* **Y:** Labels associated with the image: "car", "person", "bicycle".
* **Mt:** A mask, initially somewhat blurred or undefined.
* **Multi-Label Classification Model:** A model that predicts multiple labels for an input image.
* **Step 1:** The first step involves feeding Training Data 1 into the Multi-Label Classification Model.
* **CAMs (Class Activation Maps):** Visual representations highlighting the regions in the image that contribute most to the classification of specific labels. Three CAMs are shown:
* "car": Highlights the car in the image.
* "person": Highlights the person in the image.
* "bicycle": Highlights the bicycle in the image.
* **Selection Expansion:** A process that uses the CAMs to generate a pseudo-mask.
* **Step 2:** The second step involves Selection Expansion.
* **Training Data 2:** Contains a Pseudo-Mask and the input image (X).
* **Pseudo-Mask:** A mask generated from the CAMs, showing different regions corresponding to different labels.
* **X:** The same input image as in Training Data 1.
* **Segmentation Model:** A model that segments the image into different regions based on the labels.
* **Step 3:** The third step involves feeding Training Data 2 into the Segmentation Model.
* **Mask:** The output of the Segmentation Model, representing the segmented image.
* **c1:"cat", c2:"car", cn:"bus":** Class-specific masks, where each mask corresponds to a specific class.
* **c1:"cat":** A mask for the "cat" class, colored in red.
* **c2:"car":** A mask for the "car" class, colored in gray.
* **cn:"bus":** A mask for the "bus" class, colored in teal.
* **α1, α2, αn:** Weights associated with each class-specific mask.
* **∑i=1n αi * ci * P(ci):** A weighted sum of the class-specific masks, where P(ci) represents the probability of class ci.
* **Mt+1:** The updated mask, which is a combination of the class-specific masks.
* **Step 4:** The fourth step involves combining the class-specific masks to update the mask.
* **t = t + 1:** Indicates an iterative process where the mask is updated in each iteration.
* **Concat:** Indicates that the updated mask (Mt+1) is concatenated with the input data for the next iteration.
* **Output if t = T:** Indicates that the final output is generated when the iteration reaches a termination condition (t = T).
### Detailed Analysis
The diagram illustrates an iterative process for training a segmentation model using multi-label classification.
1. **Initial Training Data:** The process starts with Training Data 1, which includes an image (X) and its corresponding labels (Y).
2. **Multi-Label Classification:** The Multi-Label Classification Model predicts multiple labels for the input image.
3. **CAM Generation:** The CAMs highlight the regions in the image that contribute most to the classification of specific labels.
4. **Selection Expansion:** The CAMs are used to generate a Pseudo-Mask, which provides a rough segmentation of the image.
5. **Segmentation Model Training:** The Segmentation Model is trained using Training Data 2, which includes the Pseudo-Mask and the input image.
6. **Mask Update:** The output of the Segmentation Model is used to update the mask (Mt+1).
7. **Iteration:** The process is repeated iteratively, with the updated mask being used as input for the next iteration.
8. **Final Output:** The final output is generated when the iteration reaches a termination condition (t = T).
The class-specific masks (c1, c2, cn) represent the segmentation of the image into different regions based on the predicted labels. The weights (α1, α2, αn) determine the contribution of each class-specific mask to the final mask.
### Key Observations
* The diagram shows an iterative process for training a segmentation model using multi-label classification.
* The CAMs are used to generate a Pseudo-Mask, which provides a rough segmentation of the image.
* The class-specific masks represent the segmentation of the image into different regions based on the predicted labels.
* The weights determine the contribution of each class-specific mask to the final mask.
### Interpretation
The diagram illustrates a method for training a segmentation model using multi-label classification. The key idea is to use CAMs to generate a Pseudo-Mask, which provides a rough segmentation of the image. This Pseudo-Mask is then used to train a Segmentation Model, which refines the segmentation. The iterative process allows the model to learn from its mistakes and improve its performance over time. The use of class-specific masks and weights allows the model to handle multiple labels and segment the image into different regions based on the predicted labels. This approach is useful for tasks such as object detection and image segmentation, where it is important to identify and segment different objects in an image.