## Diagram Type: Flowchart
### Overview
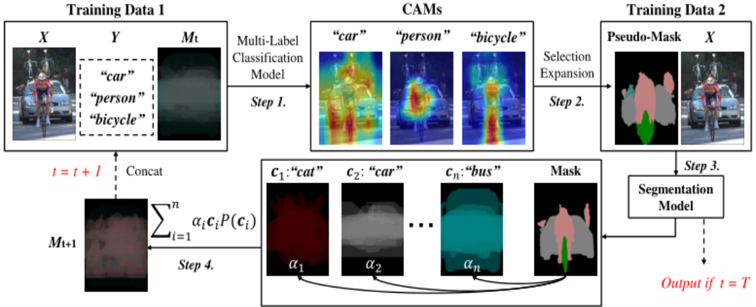
The image is a flowchart illustrating the process of training a multi-label classification model using CAMs (Class Activation Maps) for object detection. The flowchart is divided into several steps, each representing a phase in the training process.
### Components/Axes
- **Training Data 1**: Shows images labeled "car," "person," and "bicycle."
- **Training Data 2**: Shows images labeled "car," "person," and "bicycle."
- **CAMs**: Represents the process of generating class activation maps.
- **Multi-Label Classification Model**: The model used for classification.
- **Selection Expansion**: A step in the CAM generation process.
- **Pseudo-Mask**: A mask used in the CAM generation process.
- **Segmentation Model**: The final model used for segmentation.
- **Output if t = T**: The output of the segmentation model when the training is complete.
### Detailed Analysis or ### Content Details
- **Step 1**: The images are processed to generate class activation maps.
- **Step 2**: The class activation maps are used to create a pseudo-mask.
- **Step 3**: The pseudo-mask is used to segment the images.
- **Step 4**: The segmented images are used to train the segmentation model.
### Key Observations
- The flowchart shows a clear progression from training data to the final segmentation model.
- The use of CAMs is a technique used to visualize the importance of different features in the classification process.
- The pseudo-mask is used to refine the segmentation process.
### Interpretation
The flowchart demonstrates the process of training a multi-label classification model using CAMs for object detection. The use of CAMs helps to visualize the importance of different features in the classification process, and the pseudo-mask is used to refine the segmentation process. The final segmentation model is trained using the segmented images, which are generated using the pseudo-mask. This process is repeated for each image in the training data, and the output is the segmentation model when the training is complete. The flowchart provides a clear and concise explanation of the process, making it easy to understand.