## Light Curve Analysis: OGLE-2017-BLG-1806
### Overview
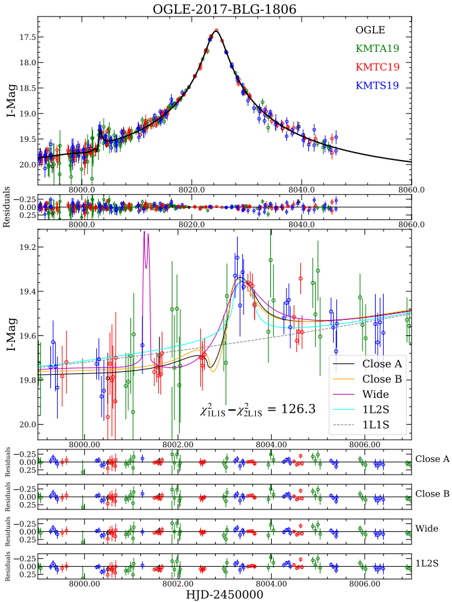
The image presents a light curve analysis of the astronomical event OGLE-2017-BLG-1806. It consists of two main plots showing the I-band magnitude (I-Mag) variation over time (HJD-2450000), along with residual plots below each main plot. The first plot shows the overall light curve, while the second plot focuses on a specific region with different models fitted.
### Components/Axes
**Top Plot:**
* **Title:** OGLE-2017-BLG-1806
* **Y-axis:** I-Mag (I-band magnitude), ranging from approximately 17.5 to 20.0.
* **X-axis:** HJD-2450000 (Heliocentric Julian Date minus 2450000), ranging from 8000.0 to 8060.0.
* **Data Series:**
* OGLE (no color specified, but represented by a black line)
* KMTA19 (green data points)
* KMTC19 (red data points)
* KMTS19 (blue data points)
* **Residuals Plot (below top plot):**
* Y-axis: Residuals, ranging from -0.25 to 0.25.
* X-axis: HJD-2450000, ranging from 8000.0 to 8060.0.
* Data points correspond to the KMTA19 (green), KMTC19 (red), and KMTS19 (blue) datasets.
**Bottom Plot:**
* **Y-axis:** I-Mag, ranging from approximately 19.2 to 20.0.
* **X-axis:** HJD-2450000, ranging from 8000.00 to 8006.00.
* **Data Series:**
* Close A (black line)
* Close B (brown/orange line)
* Wide (purple line)
* 1L2S (cyan line)
* 1L1S (dashed gray line)
* **Text:** χ²_1L1S - χ²_2L1S = 126.3
* **Residuals Plots (below bottom plot):**
* Y-axis: Residuals, ranging from -0.25 to 0.25.
* X-axis: HJD-2450000, ranging from 8000.00 to 8006.00.
* Data points correspond to the Close A (black), Close B (green), Wide (red), and 1L2S (blue) datasets.
### Detailed Analysis
**Top Plot:**
* The OGLE data (black line) shows a clear peak around HJD-2450000 = 8025. This indicates a brightening event.
* KMTA19 (green), KMTC19 (red), and KMTS19 (blue) data points generally follow the trend of the OGLE data, with some scatter.
* The residuals plot shows the difference between the data points and the OGLE model. The residuals appear to be randomly distributed around zero, suggesting a good fit overall.
**Bottom Plot:**
* This plot zooms in on the region around HJD-2450000 = 8000 to 8006.
* The Close A (black), Close B (brown/orange), Wide (purple), 1L2S (cyan), and 1L1S (dashed gray) lines represent different models fitted to the data.
* The models diverge significantly in this region, suggesting that the data can be used to discriminate between them.
* The residuals plots show the difference between the data points and the corresponding models.
### Key Observations
* The OGLE data shows a significant brightening event around HJD-2450000 = 8025.
* Different models (Close A, Close B, Wide, 1L2S, 1L1S) provide varying fits to the data, particularly in the zoomed-in region.
* The value χ²_1L1S - χ²_2L1S = 126.3 suggests a significant difference in the goodness-of-fit between the 1L1S and 2L1S models.
### Interpretation
The light curve analysis of OGLE-2017-BLG-1806 reveals a microlensing event. The peak in the I-band magnitude indicates a temporary brightening of the source star due to the gravitational lensing effect of a foreground object. The different models (Close A, Close B, Wide, 1L2S, 1L1S) represent different physical scenarios for the lensing system, such as the presence of a binary lens or a planet orbiting the lens star. The residuals plots and the χ² difference provide information about the goodness-of-fit of each model, allowing astronomers to determine which scenario is most likely. The large difference in χ² between the 1L1S and 2L1S models suggests that the 2L1S model provides a significantly better fit to the data.