\n
## Light Curve Analysis: OGLE-2017-BLG-1806
### Overview
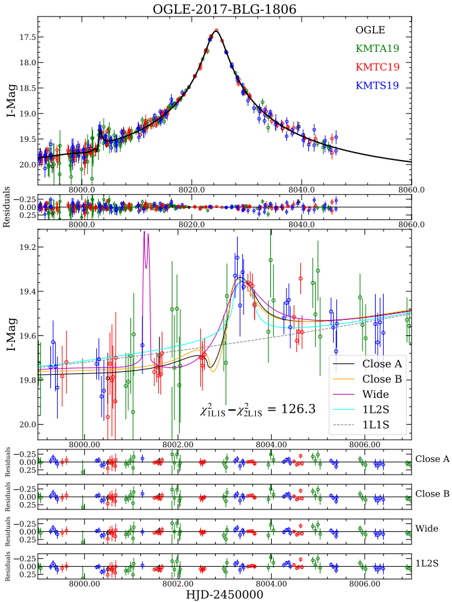
The image presents a light curve analysis of the microlensing event OGLE-2017-BLG-1806. It consists of three subplots, each displaying the I-band magnitude (I-Mag) over time (HJD-2450000). The top subplot shows the overall light curve with multiple observational datasets. The middle subplot focuses on the peak of the microlensing event, with additional model fits. The bottom subplot displays the residuals for each dataset.
### Components/Axes
* **X-axis (all subplots):** HJD-2450000 (Heliocentric Julian Date - 2450000). Scale ranges from approximately 8000.0 to 8060.0.
* **Y-axis (top & middle subplots):** I-Mag (I-band Magnitude). Scale ranges from approximately 17.5 to 19.5 (top) and 19.2 to 19.8 (middle).
* **Y-axis (bottom subplots):** Residuals. Scale ranges from approximately -0.25 to 0.25.
* **Legend (middle subplot, bottom-right):**
* OGLE (Black)
* KMTA19 (Red)
* KMTC19 (Blue)
* KMTS19 (Green)
* Close A (Dark Cyan)
* Close B (Dark Red)
* Wide (Dark Green)
* 1L2S (Dark Blue)
* 1L1S (Dark Magenta)
* **Title (top subplot):** OGLE-2017-BLG-1806
* **Text (middle subplot, bottom-center):** χ<sup>2</sup><sub>LIS</sub> - χ<sup>2</sup><sub>ILIS</sub> = 126.3
### Detailed Analysis or Content Details
**Top Subplot:**
* The light curve shows a clear microlensing event, with a peak around HJD-2450000 = 8040.0.
* OGLE (Black): Data points are sparse, showing a general upward trend before the peak and a downward trend after. Magnitude values range from approximately 18.2 to 19.2.
* KMTA19 (Red): Data points are more densely populated around the peak. Magnitude values range from approximately 17.8 to 19.5. The curve shows a sharp increase to the peak and a slower decrease.
* KMTC19 (Blue): Similar to KMTA19, with a peak magnitude around 18.0 and a range of 18.0 to 19.3.
* KMTS19 (Green): Data points are concentrated around the peak, with magnitude values ranging from approximately 18.1 to 19.4.
**Middle Subplot:**
* This subplot focuses on the peak of the microlensing event.
* The best-fit model (black line) closely follows the KMTA19 (red), KMTC19 (blue), and KMTS19 (green) data points around the peak.
* Close A (Dark Cyan): A relatively flat line around I-Mag = 19.7.
* Close B (Dark Red): A relatively flat line around I-Mag = 19.7.
* Wide (Dark Green): A relatively flat line around I-Mag = 19.7.
* 1L2S (Dark Blue): A relatively flat line around I-Mag = 19.7.
* 1L1S (Dark Magenta): A relatively flat line around I-Mag = 19.7.
* The peak magnitude is approximately 17.8 (from KMTA19, KMTC19, and KMTS19).
**Bottom Subplots:**
* These subplots show the residuals (difference between observed data and model) for each dataset.
* OGLE (top): Residuals are scattered around zero, with some positive and negative deviations.
* KMTA19 (middle): Residuals are generally small, indicating a good fit.
* KMTC19 (bottom): Residuals are generally small, indicating a good fit.
* KMTS19 (bottom): Residuals are generally small, indicating a good fit.
* Close A (top): Residuals are scattered around zero.
* Close B (middle): Residuals are scattered around zero.
* Wide (bottom): Residuals are scattered around zero.
* 1L2S (bottom): Residuals are scattered around zero.
### Key Observations
* The microlensing event shows a well-defined peak, indicating a clear alignment between the source star, lens star, and observer.
* The KMTA19, KMTC19, and KMTS19 datasets provide the most detailed coverage of the peak, allowing for a precise determination of the event parameters.
* The residuals are generally small, suggesting that the model provides a good fit to the observed data.
* The χ<sup>2</sup><sub>LIS</sub> - χ<sup>2</sup><sub>ILIS</sub> value of 126.3 indicates the quality of the fit.
### Interpretation
The data demonstrates a microlensing event caused by a foreground star (the lens) passing in front of a background star (the source). The brightening of the source star's light is due to the gravitational focusing effect of the lens. The shape of the light curve provides information about the mass of the lens, its distance from the source, and its relative motion. The multiple datasets (OGLE, KMTA19, KMTC19, KMTS19) provide independent measurements of the light curve, allowing for a robust analysis. The residuals indicate the accuracy of the model used to fit the data. The different model fits (Close A, Close B, Wide, 1L2S, 1L1S) likely represent different possible configurations of the lens system, and the best-fit model is chosen based on the lowest residuals and the χ<sup>2</sup> value. The value of χ<sup>2</sup><sub>LIS</sub> - χ<sup>2</sup><sub>ILIS</sub> = 126.3 is a statistical measure of the goodness of fit, with lower values indicating a better fit. The data suggests a relatively simple microlensing event, with no evidence of complex features such as planetary companions or binary lenses.