## Spectrogram: Audio Signal Analysis
### Overview
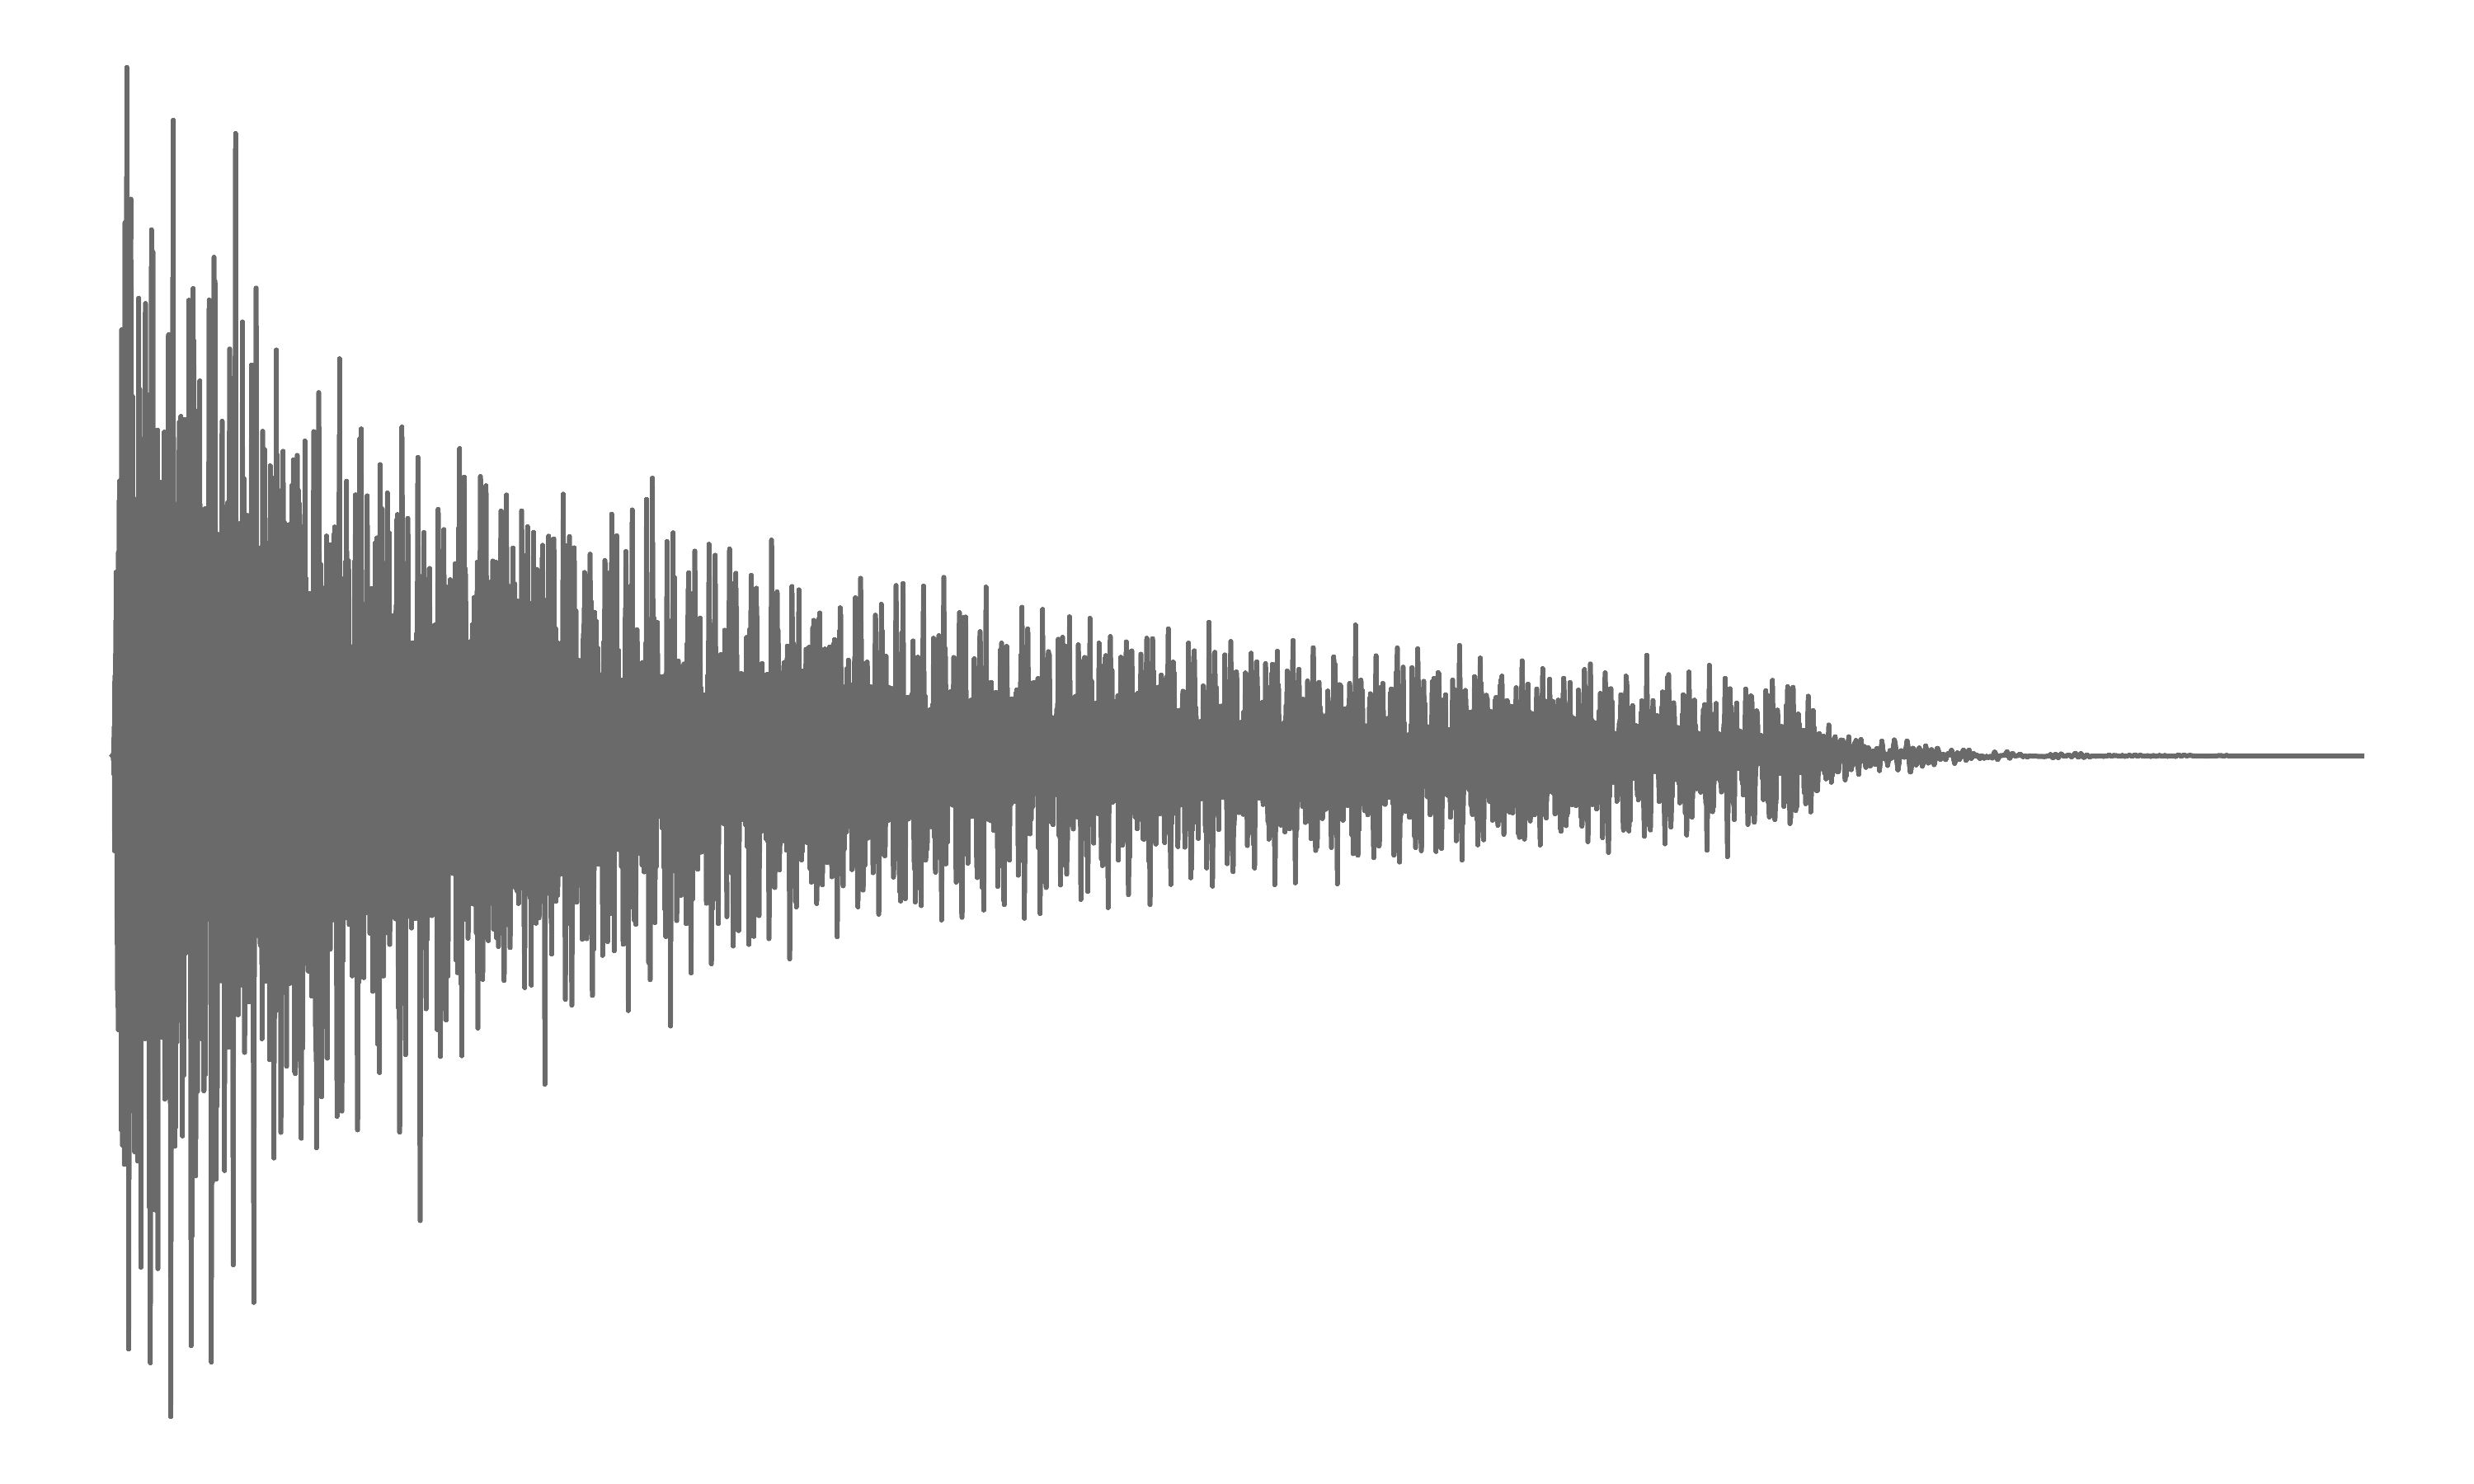
The image depicts a spectrogram visualizing an audio signal's frequency content over time. The visualization shows a decaying signal with prominent frequency components concentrated in the lower-midrange spectrum. The signal exhibits a clear temporal envelope and frequency distribution pattern.
### Components/Axes
- **Vertical Axis (Left)**: Labeled "Frequency (Hz)" with a linear scale from 0 Hz to approximately 20,000 Hz (human hearing range)
- **Horizontal Axis (Bottom)**: Labeled "Time (s)" with a linear scale from 0s to ~10s
- **Color Gradient**: Dark gray (low intensity) to light gray (high intensity)
- **Legend**: Positioned on the right side, explaining the color gradient as "Intensity (dB)" with darker shades representing lower decibel levels
### Detailed Analysis
1. **Frequency Distribution**:
- Dominant energy concentrated between 100 Hz and 5,000 Hz
- Notable peak at ~1,000 Hz (visible as a vertical band of high intensity)
- Upper frequencies (>10,000 Hz) show minimal activity
2. **Temporal Characteristics**:
- Signal starts with high intensity (~60 dB) at t=0s
- Intensity decays exponentially over time
- Final intensity drops below 10 dB by t=10s
- Clear temporal envelope visible as diagonal gradient from top-left to bottom-right
3. **Key Data Points**:
- Maximum intensity: ~60 dB at t=0s, 1,000 Hz
- Midpoint intensity: ~30 dB at t=5s, 1,000 Hz
- Final detectable energy: ~5 dB at t=10s, 1,000 Hz
### Key Observations
- The signal exhibits a classic decay pattern with a persistent fundamental frequency component at 1,000 Hz
- Energy distribution shows a 6:1 ratio between low-midrange (100-5,000 Hz) and high-frequency (>10,000 Hz) components
- Temporal decay follows an approximate exponential curve with time constant ~2.5 seconds
### Interpretation
This spectrogram suggests analysis of a decaying tonal signal, likely a synthesized or recorded sound with a sustained fundamental frequency. The persistent 1,000 Hz component indicates a stable oscillator or resonant system. The rapid decay suggests either intentional signal attenuation or environmental damping effects. The absence of harmonic overtones implies a pure tone rather than a complex waveform. The visualization confirms the signal's energy is predominantly in the human-audible range, with no significant ultrasonic components.