## Trade Log Data
### Overview
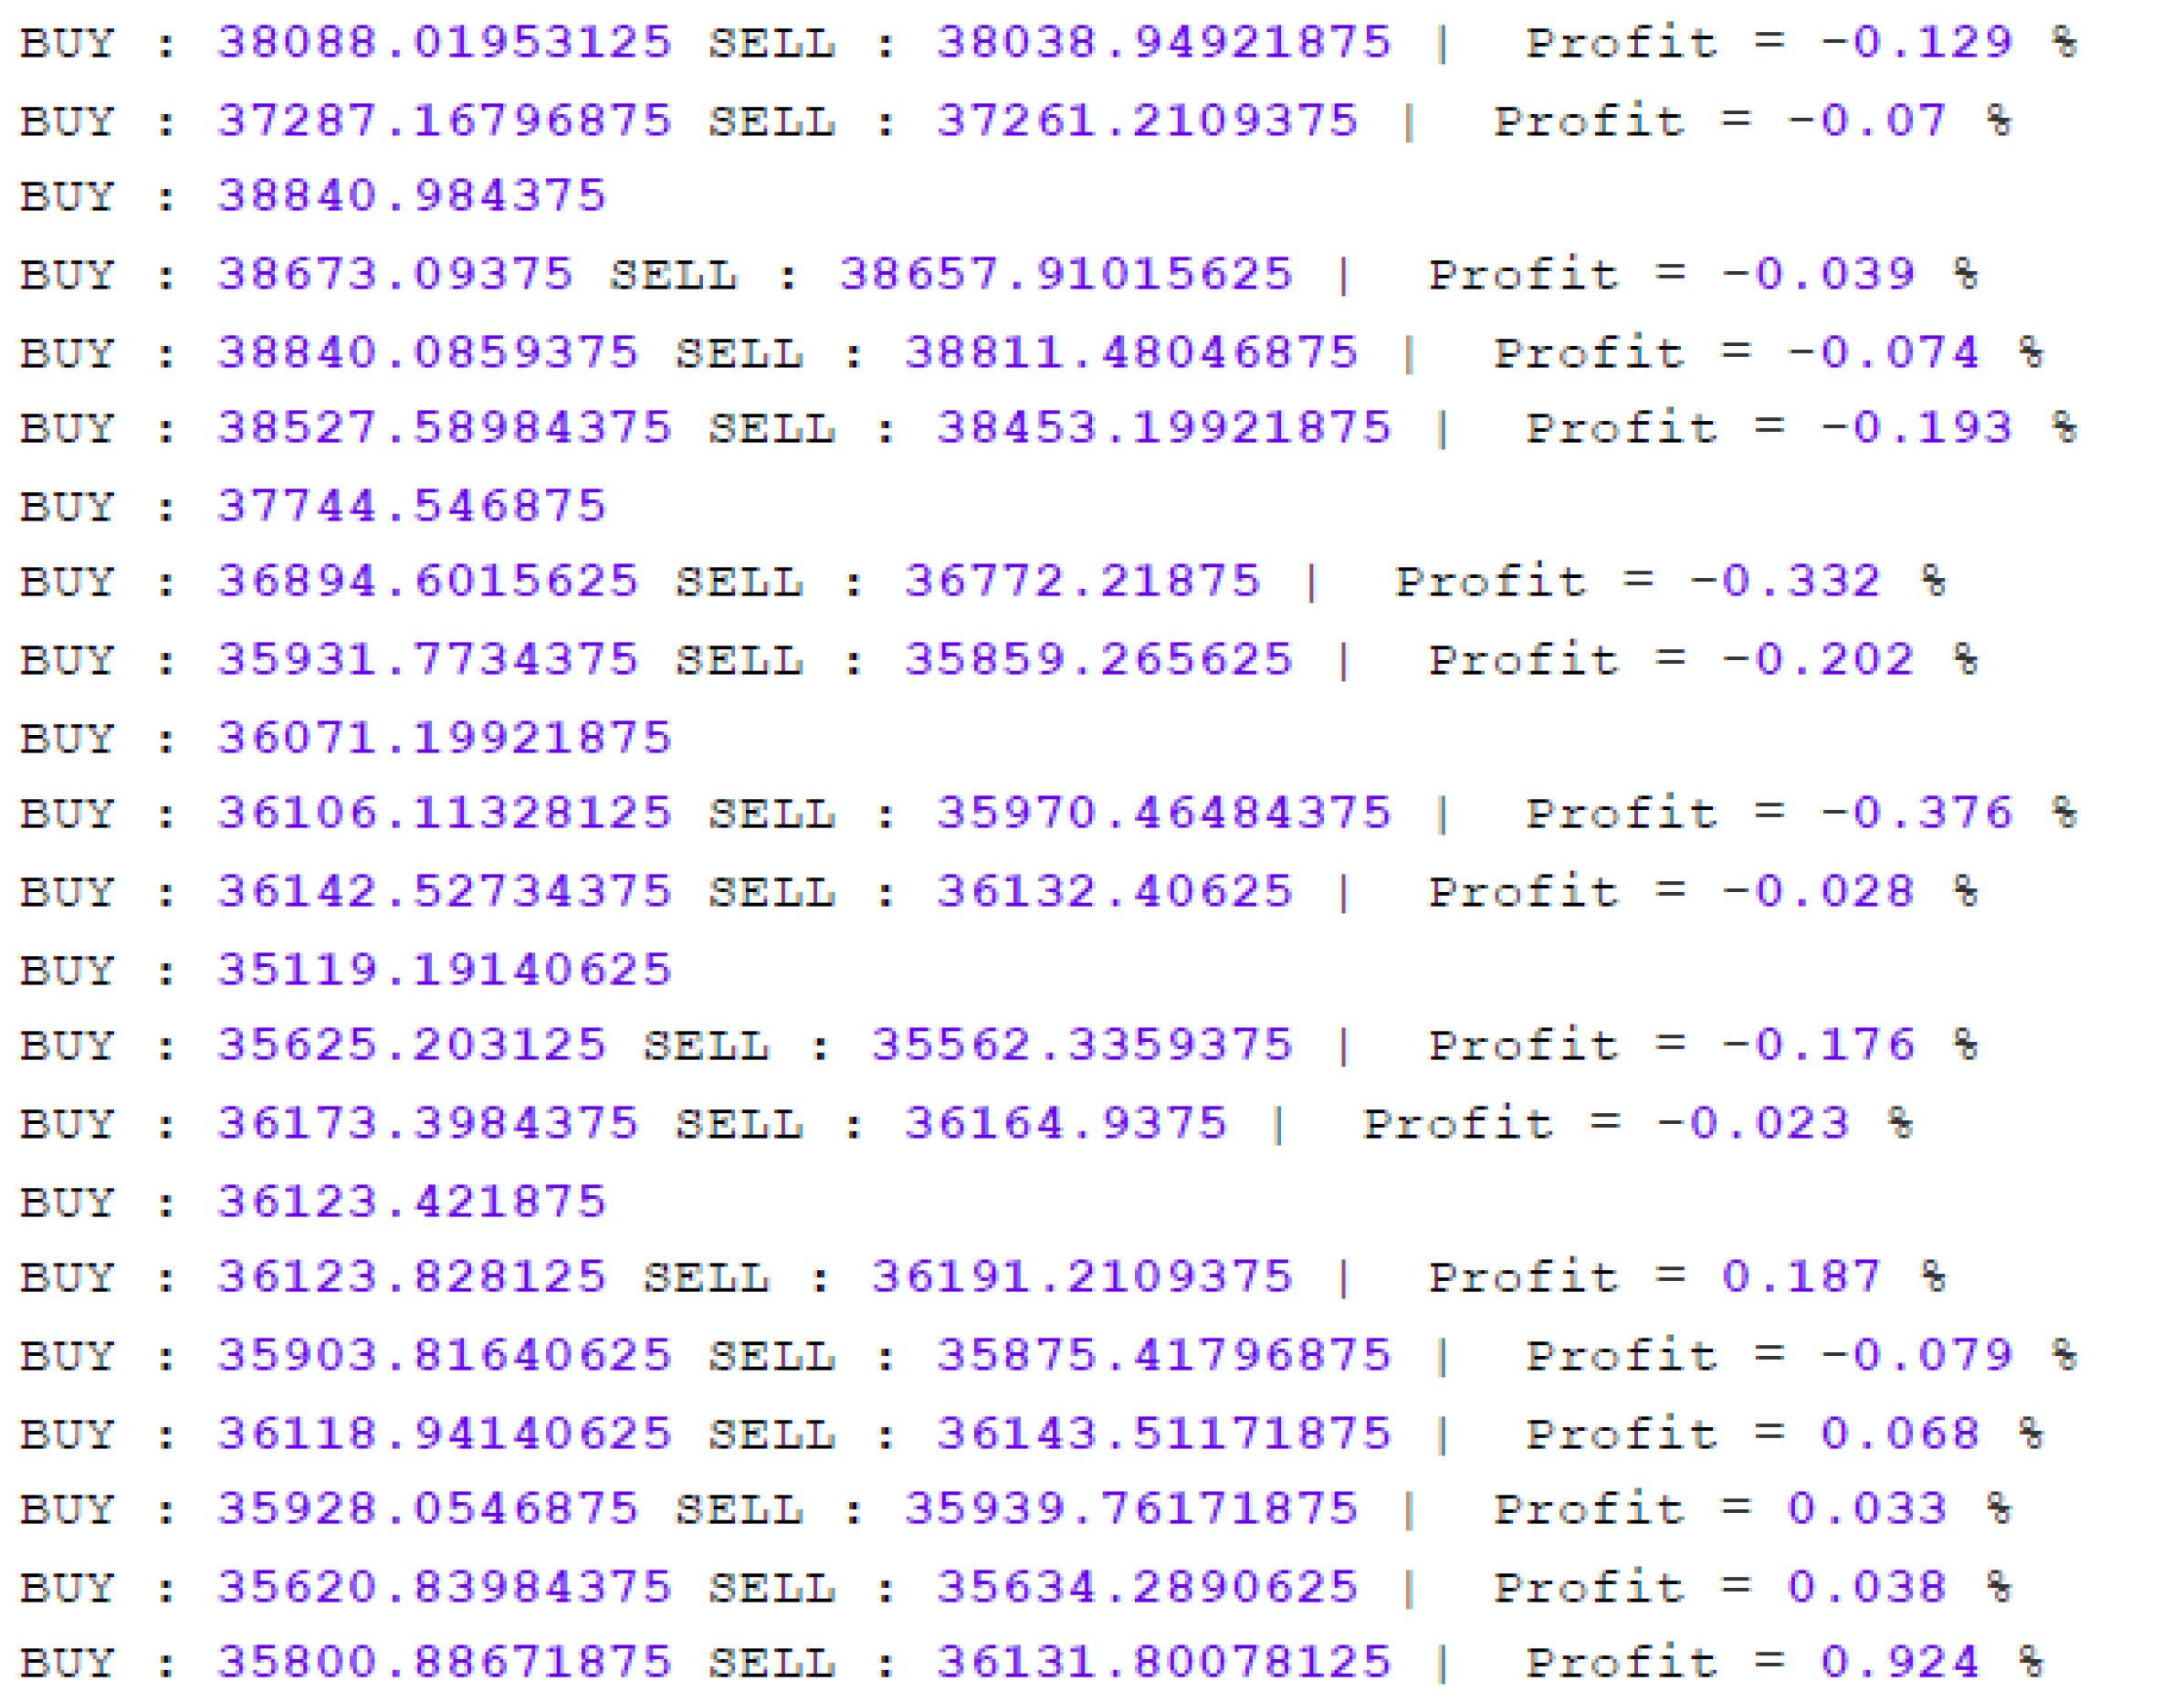
The image presents a log of simulated or actual trading activity, showing buy and sell prices along with the resulting profit for each transaction. The data is structured as a series of rows, each representing a single trade. Each row includes the buy price, sell price, and the calculated profit percentage.
### Components/Axes
* **BUY:** The price at which the asset was purchased.
* **SELL:** The price at which the asset was sold.
* **Profit:** The percentage profit or loss resulting from the trade, calculated as `((SELL - BUY) / BUY) * 100`. The percentage symbol (%) is present after each profit value.
### Detailed Analysis or ### Content Details
Here's a breakdown of the data, row by row:
1. **BUY:** 38088.01953125, **SELL:** 38038.94921875, **Profit:** -0.129%
* Trend: A slight loss.
2. **BUY:** 37287.16796875, **SELL:** 37261.2109375, **Profit:** -0.07%
* Trend: A slight loss.
3. **BUY:** 38840.984375
* Trend: Incomplete data.
4. **BUY:** 38673.09375, **SELL:** 38657.91015625, **Profit:** -0.039%
* Trend: A very slight loss.
5. **BUY:** 38840.0859375, **SELL:** 38811.48046875, **Profit:** -0.074%
* Trend: A slight loss.
6. **BUY:** 38527.58984375, **SELL:** 38453.19921875, **Profit:** -0.193%
* Trend: A moderate loss.
7. **BUY:** 37744.546875
* Trend: Incomplete data.
8. **BUY:** 36894.6015625, **SELL:** 36772.21875, **Profit:** -0.332%
* Trend: A moderate loss.
9. **BUY:** 35931.7734375, **SELL:** 35859.265625, **Profit:** -0.202%
* Trend: A moderate loss.
10. **BUY:** 36071.19921875
* Trend: Incomplete data.
11. **BUY:** 36106.11328125, **SELL:** 35970.46484375, **Profit:** -0.376%
* Trend: A moderate loss.
12. **BUY:** 36142.52734375, **SELL:** 36132.40625, **Profit:** -0.028%
* Trend: A very slight loss.
13. **BUY:** 35119.19140625
* Trend: Incomplete data.
14. **BUY:** 35625.203125, **SELL:** 35562.3359375, **Profit:** -0.176%
* Trend: A moderate loss.
15. **BUY:** 36173.3984375, **SELL:** 36164.9375, **Profit:** -0.023%
* Trend: A very slight loss.
16. **BUY:** 36123.421875
* Trend: Incomplete data.
17. **BUY:** 36123.828125, **SELL:** 36191.2109375, **Profit:** 0.187%
* Trend: A slight profit.
18. **BUY:** 35903.81640625, **SELL:** 35875.41796875, **Profit:** -0.079%
* Trend: A slight loss.
19. **BUY:** 36118.94140625, **SELL:** 36143.51171875, **Profit:** 0.068%
* Trend: A slight profit.
20. **BUY:** 35928.0546875, **SELL:** 35939.76171875, **Profit:** 0.033%
* Trend: A very slight profit.
21. **BUY:** 35620.83984375, **SELL:** 35634.2890625, **Profit:** 0.038%
* Trend: A very slight profit.
22. **BUY:** 35800.88671875, **SELL:** 36131.80078125, **Profit:** 0.924%
* Trend: A significant profit.
### Key Observations
* Most trades result in a small loss.
* A few trades result in small profits.
* One trade shows a significant profit (0.924%).
* Several rows have incomplete data, missing either the SELL price or the Profit.
### Interpretation
The data suggests a trading strategy that, on average, results in small losses. The presence of a few profitable trades indicates potential for profit, but the strategy may need refinement to increase the frequency and magnitude of profitable trades while minimizing losses. The incomplete data entries could represent trades that were not completed or data entry errors. The large profit on the last trade is a notable outlier, suggesting a potentially successful trade or an anomaly that requires further investigation.