## [Text Log]: Trading Transaction Log
### Overview
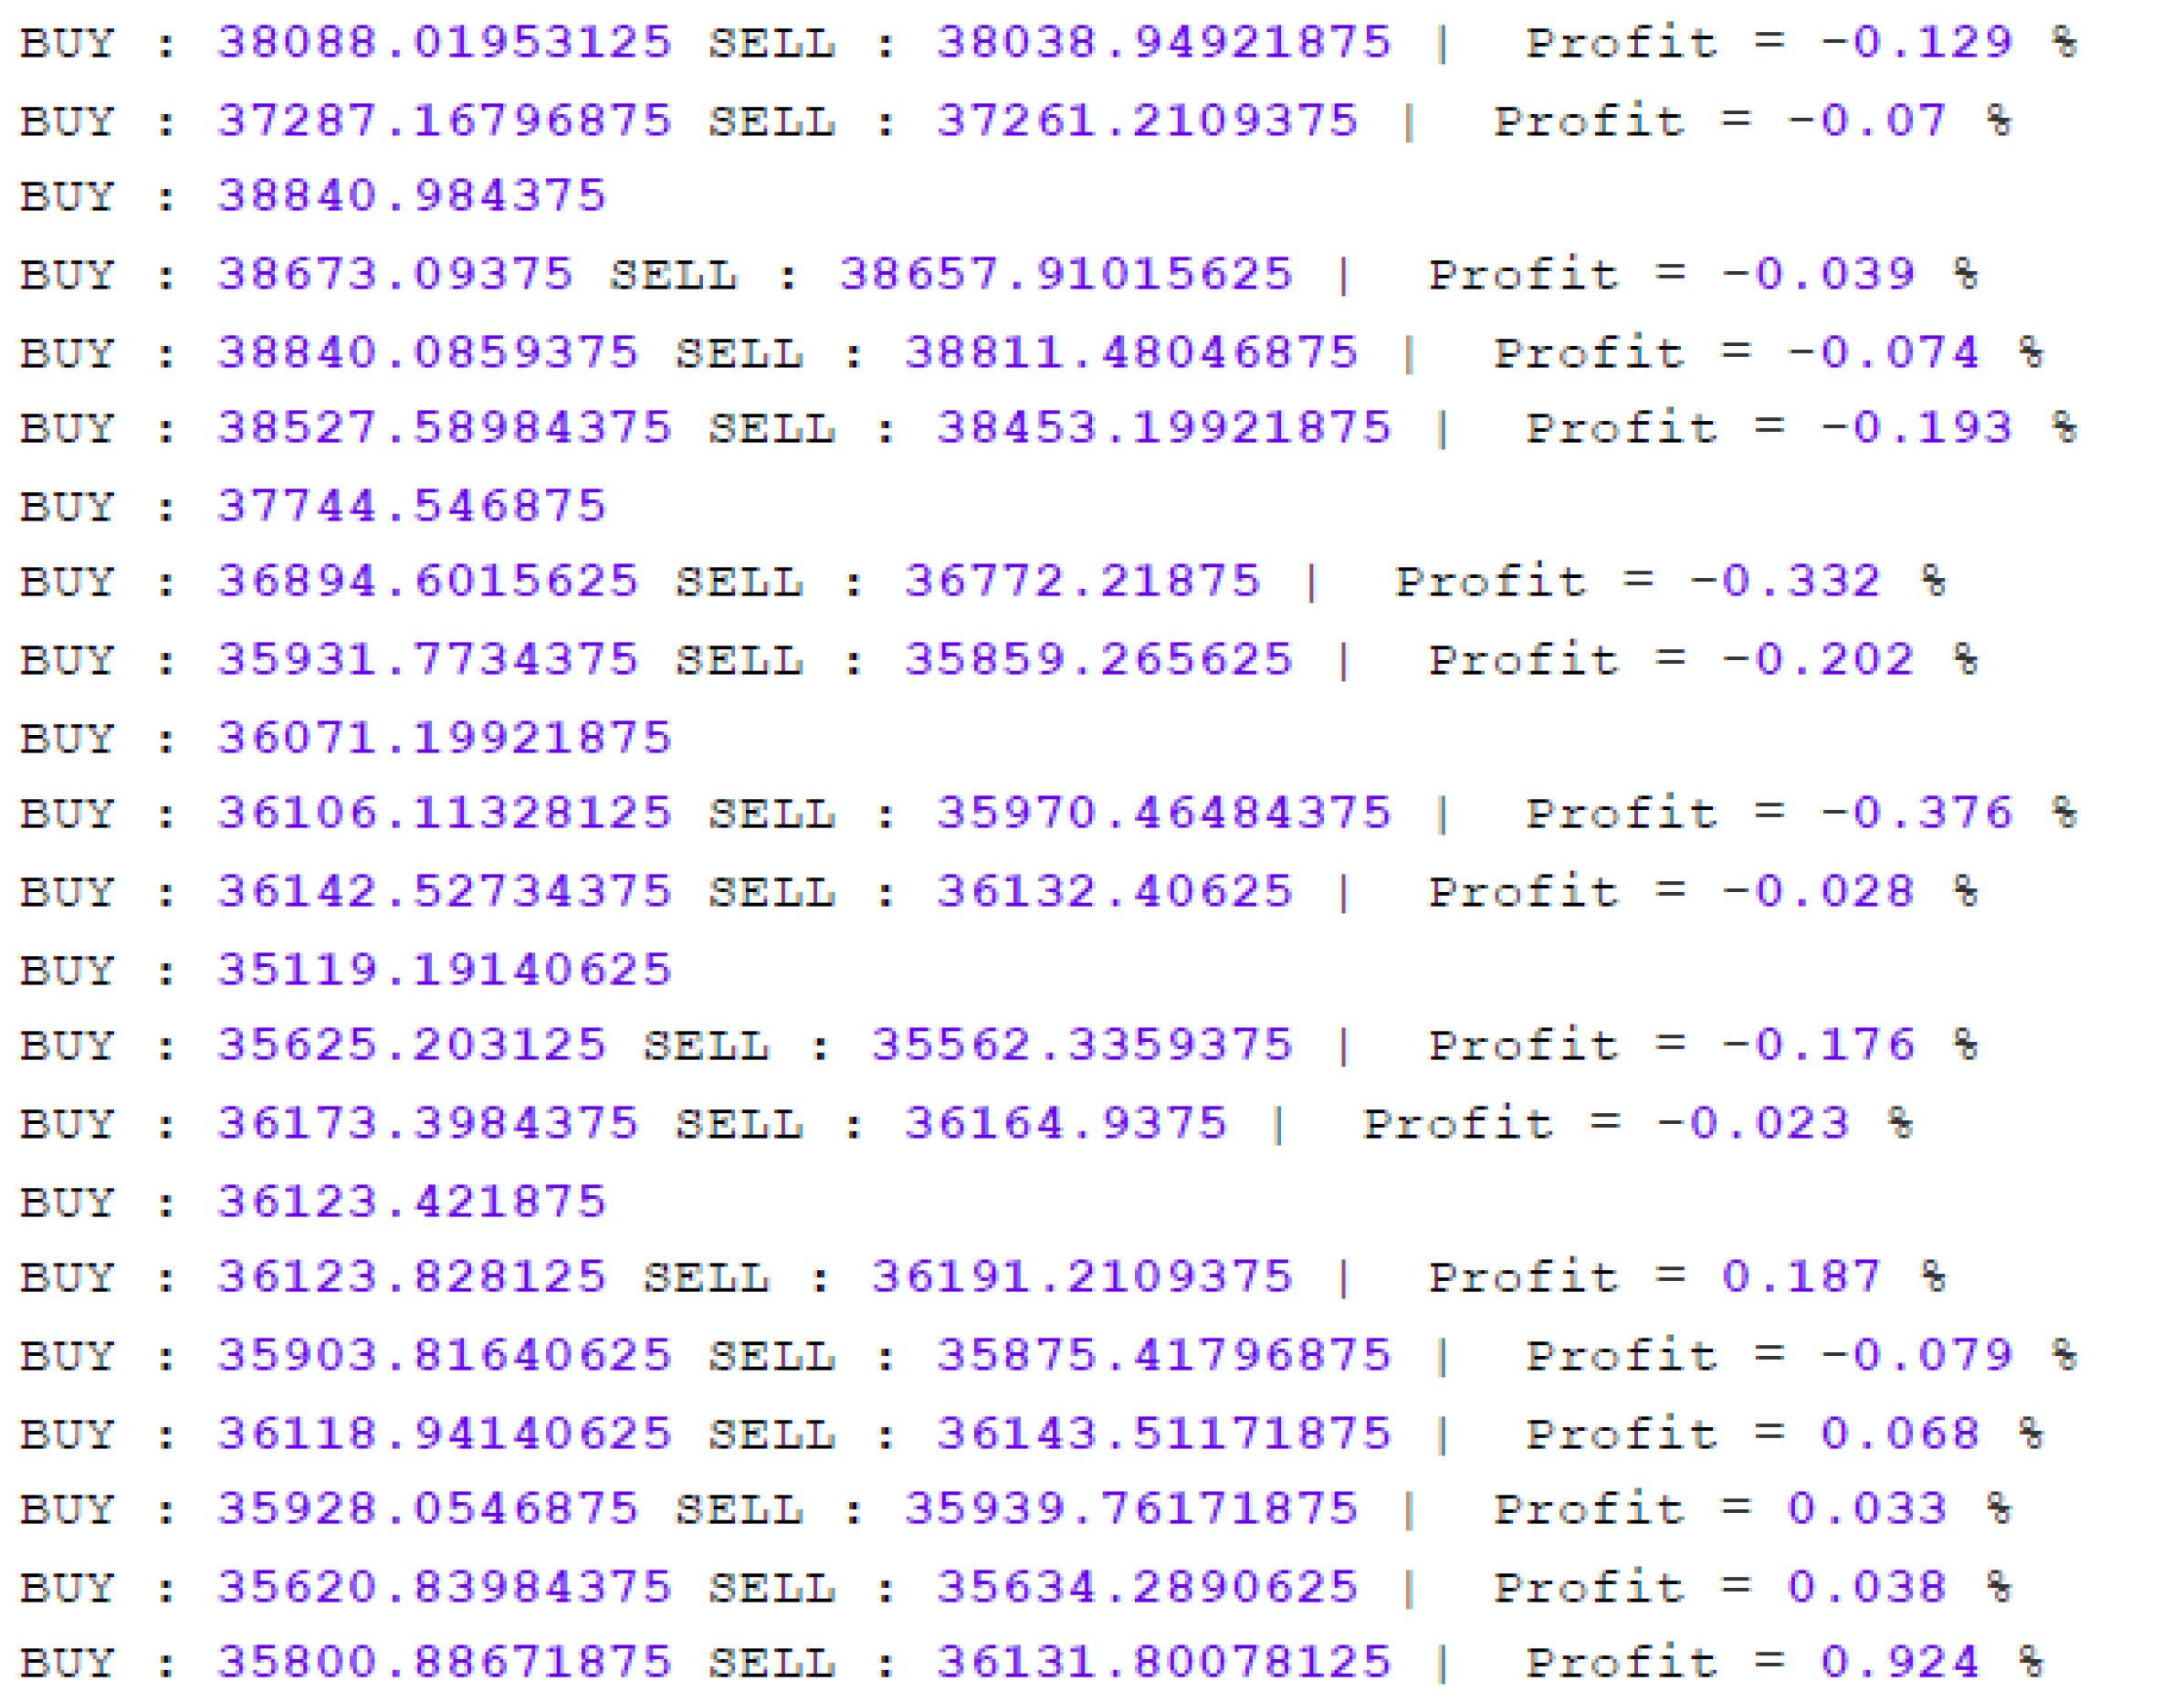
The image displays a monospaced text log containing a series of financial trading transactions. Each line represents a single trade, recording the entry (BUY) price, exit (SELL) price, and the resulting profit or loss as a percentage. The log appears to be output from an automated trading system or algorithm. The text is in English.
### Components/Axes
The log is structured as a simple list with no graphical axes or legends. The components are:
* **BUY**: The entry price for the trade.
* **SELL**: The exit price for the trade.
* **Profit**: The calculated profit or loss percentage for the trade, formatted as `Profit = [value] %`.
* **Separator**: A vertical bar (`|`) separates the price data from the profit calculation.
* **Incomplete Entries**: Some lines contain only a `BUY` price, indicating a trade that was opened but not closed within the captured log segment.
### Detailed Analysis
The following table reconstructs the complete data from the log, listing transactions in the order they appear (top to bottom). Lines with incomplete data are noted.
| Line | BUY Price | SELL Price | Profit (%) |
| :--- | :----------- | :----------- | :--------- |
| 1 | 38088.01953125 | 38038.94921875 | -0.129 |
| 2 | 37287.16796875 | 37261.2109375 | -0.07 |
| 3 | 38840.984375 | N/A | N/A |
| 4 | 38673.09375 | 38657.91015625 | -0.039 |
| 5 | 38840.0859375 | 38811.48046875 | -0.074 |
| 6 | 38527.58984375 | 38453.19921875 | -0.193 |
| 7 | 37744.546875 | N/A | N/A |
| 8 | 36894.6015625 | 36772.21875 | -0.332 |
| 9 | 35931.7734375 | 35859.265625 | -0.202 |
| 10 | 36071.19921875 | N/A | N/A |
| 11 | 36106.11328125 | 35970.46484375 | -0.376 |
| 12 | 36142.52734375 | 36132.40625 | -0.028 |
| 13 | 35119.19140625 | N/A | N/A |
| 14 | 35625.203125 | 35562.3359375 | -0.176 |
| 15 | 36173.3984375 | 36164.9375 | -0.023 |
| 16 | 36123.421875 | N/A | N/A |
| 17 | 36123.828125 | 36191.2109375 | 0.187 |
| 18 | 35903.81640625 | 35875.41796875 | -0.079 |
| 19 | 36118.94140625 | 36143.51171875 | 0.068 |
| 20 | 35928.0546875 | 35939.76171875 | 0.033 |
| 21 | 35620.83984375 | 35634.2890625 | 0.038 |
| 22 | 35800.88671875 | 36131.80078125 | 0.924 |
**Data Point Verification:**
* **Price Range**: BUY prices span from a low of **35119.19140625** (Line 13) to a high of **38840.984375** (Line 3).
* **Profit Range**: Profit percentages range from a loss of **-0.376%** (Line 11) to a gain of **+0.924%** (Line 22).
* **Trend Verification**: The sequence does not show a clear chronological trend in price (e.g., consistently rising or falling). Prices fluctuate within the ~35k-39k band. The profit values are predominantly negative in the first two-thirds of the log, shifting to mostly positive in the final third.
### Key Observations
1. **Predominantly Losing Trades**: Of the 17 completed trades (with both BUY and SELL), 12 resulted in a loss (70.59%), and 5 resulted in a profit (29.41%).
2. **Small Margins**: All profit/loss percentages are relatively small, with the largest loss being -0.376% and the largest gain being +0.924%. This suggests a high-frequency or scalping trading strategy.
3. **Incomplete Data**: Six lines (27% of the log) show only a BUY price, indicating open positions at the time the log was captured.
4. **High Precision**: Prices are recorded with 8 decimal places, which is characteristic of certain financial markets like forex or cryptocurrency trading.
5. **Performance Shift**: There is a noticeable shift in performance. The first 12 completed trades (Lines 1, 2, 4, 5, 6, 8, 9, 11, 12, 14, 15, 18) are all losses. The final 5 completed trades (Lines 17, 19, 20, 21, 22) are all profits, with the last trade showing the highest gain.
### Interpretation
This log represents the raw output of a systematic trading strategy, likely operating on a volatile asset given the price range and precision. The data suggests the strategy was **unprofitable during the initial period** captured, incurring a series of small, consistent losses. This could indicate adverse market conditions, slippage, or fees eroding margins.
The **abrupt shift to profitability in the final trades** is the most significant pattern. This could be due to:
* A change in market conditions favoring the strategy's logic.
* A adjustment in the algorithm's parameters.
* The closure of a series of losing positions and the opening of new, more successful ones.
The presence of multiple open positions (incomplete BUY entries) indicates the log is a snapshot of ongoing activity. The high precision and small profit targets point towards a quantitative, automated approach where numerous small trades are executed, aiming to aggregate gains. However, the initial loss streak highlights the challenge of achieving consistent profitability with such strategies, as transaction costs and minor price movements can quickly turn positions negative. The final positive trend, while promising, is based on a very small sample size and would require more data to confirm a sustained improvement.