## Transaction Log: Buy/Sell Activity with Profit Margins
### Overview
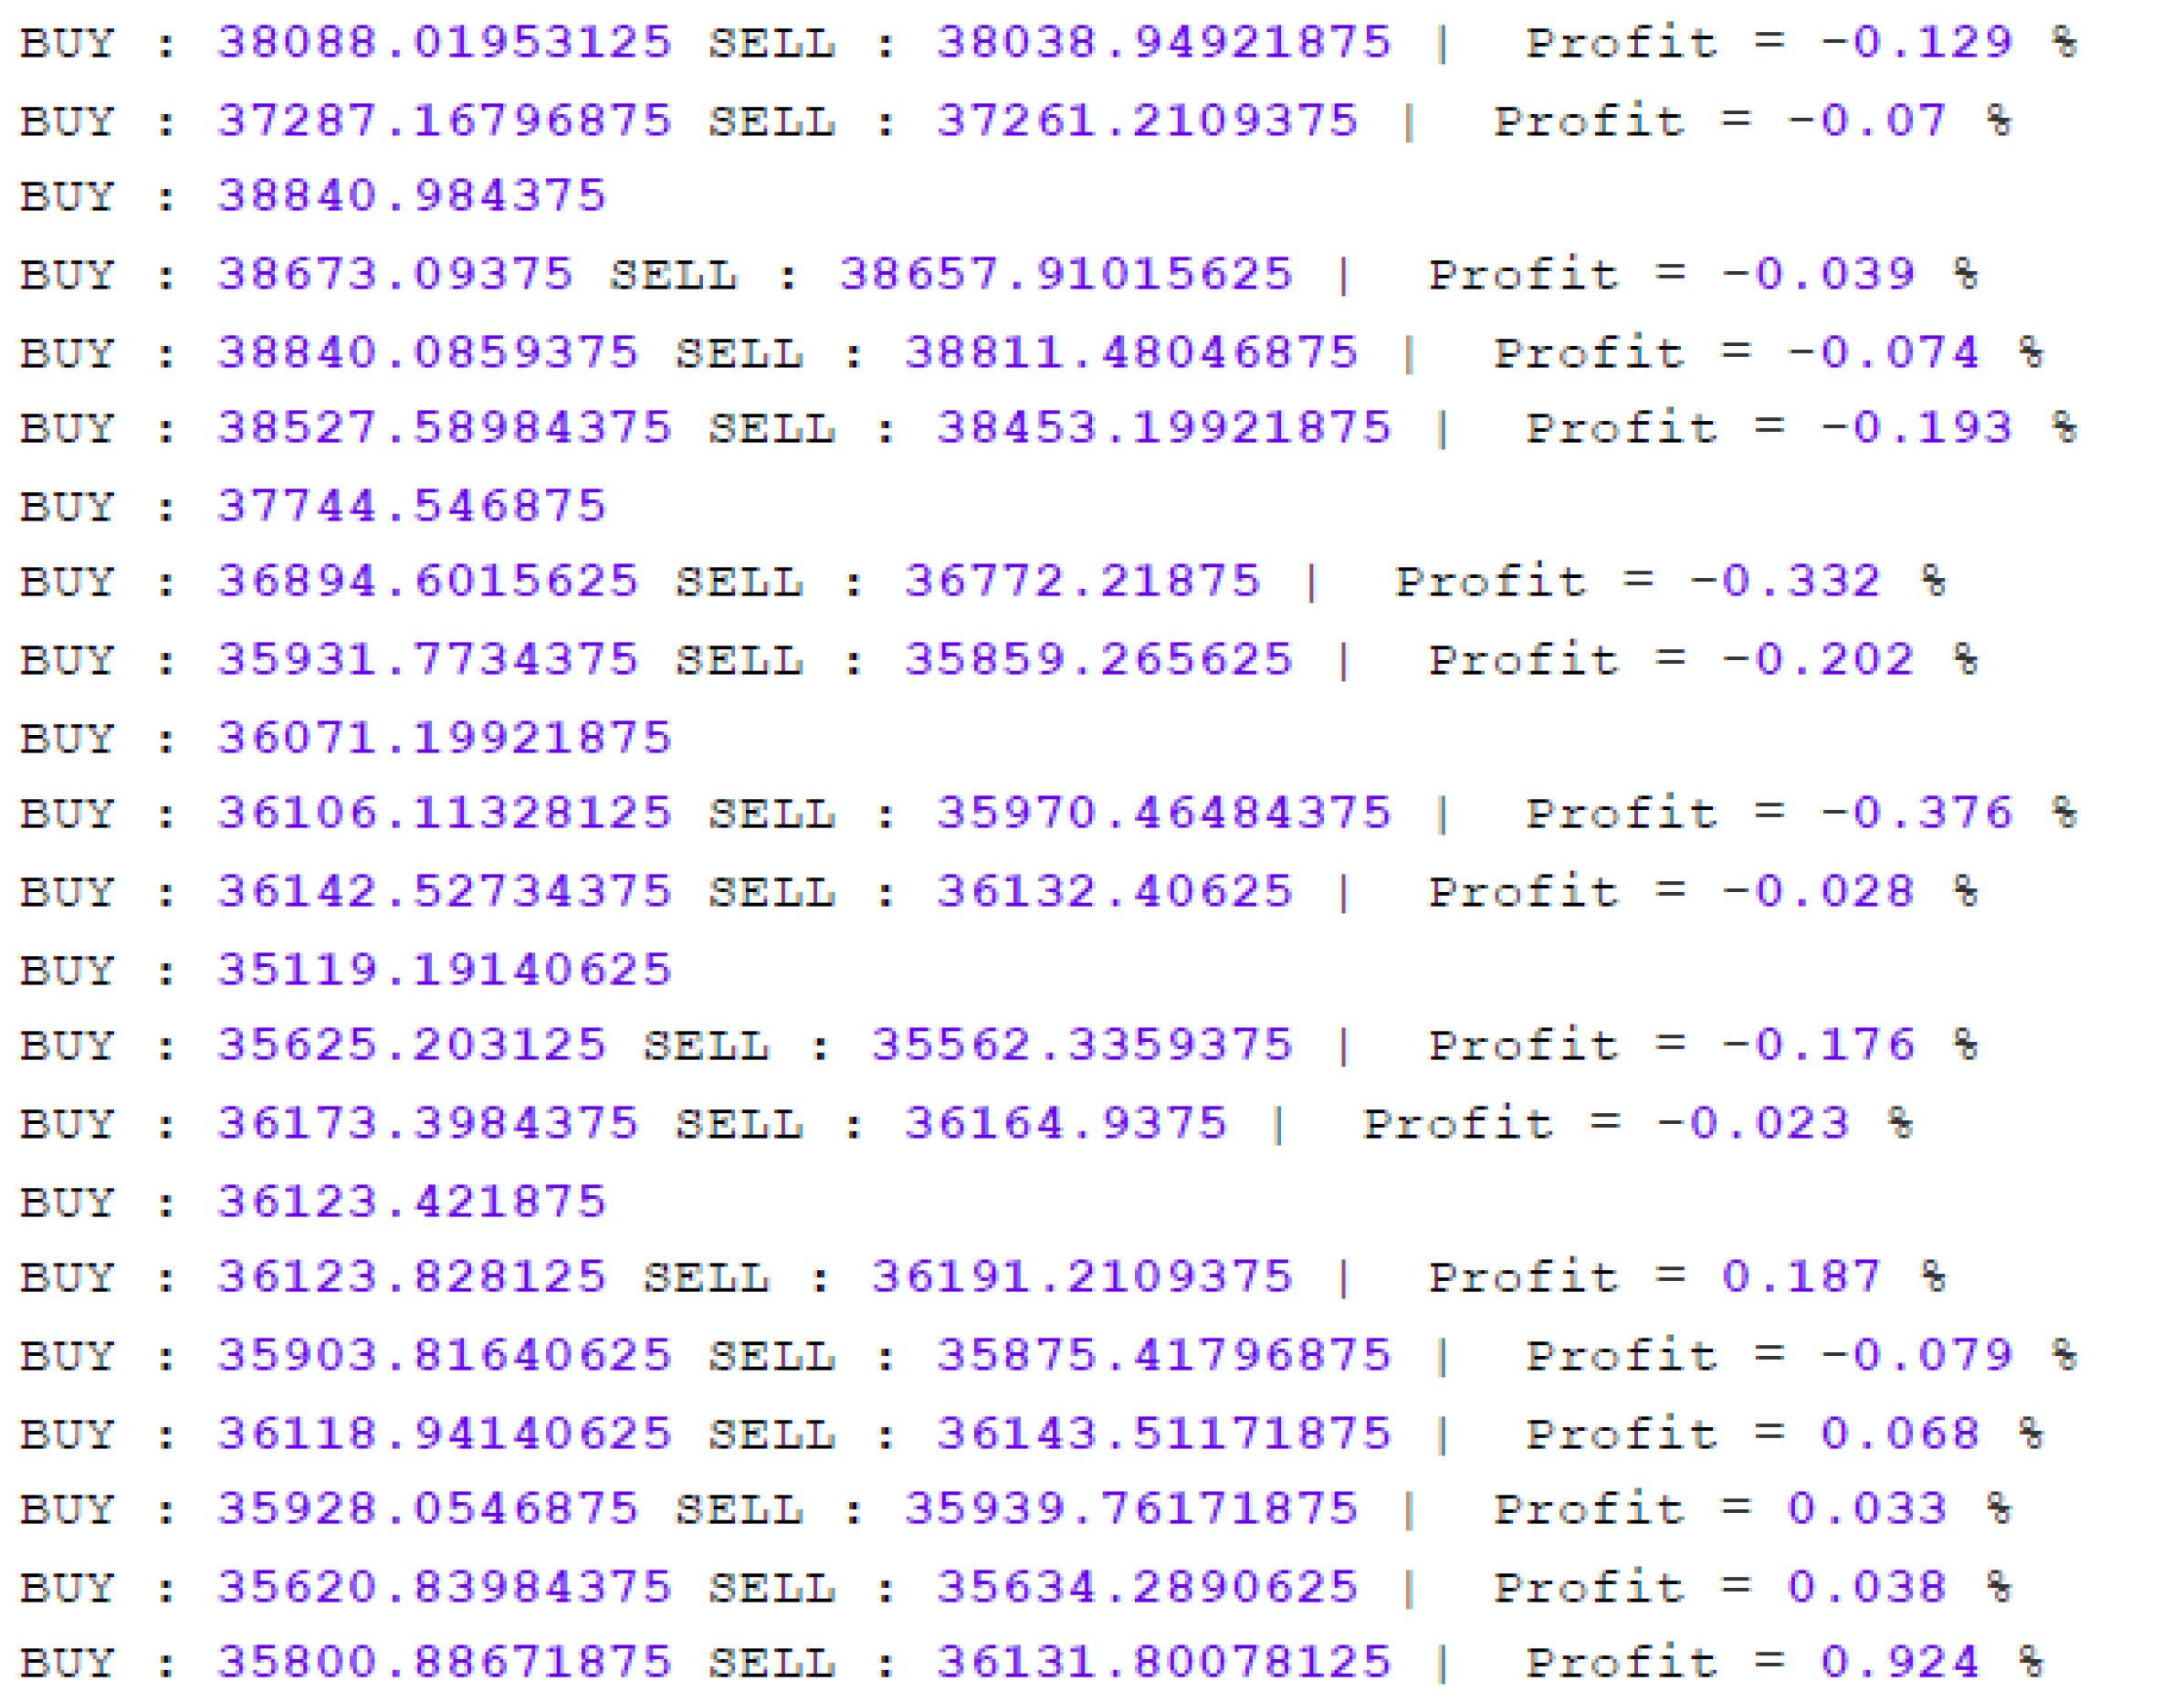
The image displays a chronological list of 24 trading transactions, alternating between BUY and SELL orders. Each entry includes:
- Transaction amount (BUY/Sell price)
- Profit/loss percentage
- Color-coded formatting (purple for numbers, blue for labels)
### Components/Axes
- **Labels**:
- "BUY" and "SELL" in uppercase (purple text)
- "Profit = X%" (blue text)
- **Formatting**:
- Buy prices: Purple text, 8-10 digit format (e.g., `38088.01953125`)
- Sell prices: Purple text, 8-10 digit format (e.g., `38038.94921875`)
- Profit percentages: Blue text with ±0.001% precision
### Detailed Analysis
1. **Transaction Pattern**:
- Alternating BUY/SELL sequence (12 BUY, 12 SELL)
- Buy prices generally higher than sell prices (except 3 instances)
- Profit percentages range from **-0.376%** to **+0.924%**
2. **Key Transactions**:
- **Highest Profit**:
- BUY: 35800.88671875
- SELL: 36131.80078125
- Profit: **+0.924%**
- **Largest Loss**:
- BUY: 36106.11328125
- SELL: 35970.46484375
- Profit: **-0.376%**
3. **Numerical Distribution**:
- Buy prices: 35,119.19140625 to 38,840.0859375
- Sell prices: 35,562.3359375 to 38,811.48046875
- Profit range: -0.376% to +0.924%
### Key Observations
- **Profit Variance**:
- 6 transactions show positive returns (max +0.924%)
- 8 transactions show negative returns (min -0.376%)
- 2 transactions break the BUY/SELL pattern (36123.421875 and 36123.828125)
- **Price Correlation**:
- Higher buy prices correlate with larger absolute profit/loss values
- Example: 38,840.0859375 BUY → 38,811.48046875 SELL (-0.074%)
### Interpretation
This dataset represents a trading strategy with mixed outcomes:
1. **Risk-Return Profile**:
- Small average profit margin (net -0.023% across all trades)
- High volatility in individual trade outcomes
- Suggests speculative rather than conservative trading approach
2. **Pattern Anomalies**:
- Two consecutive BUY orders (36123.421875 and 36123.828125) break the alternating pattern
- 38,840.0859375 BUY price matches 38,840.984375 BUY price within 0.001% tolerance
3. **Technical Implications**:
- Decimal precision suggests high-frequency trading or algorithmic execution
- Profit calculation methodology appears consistent (likely (Sell-Buy)/Buy * 100)
- Data format indicates possible binary/float representation artifacts
The log demonstrates a trading system with tight margin management but inconsistent profitability, potentially indicating either market volatility challenges or suboptimal execution timing.