## Histogram: Sentence-Stride Δ||h|| Distribution
### Overview
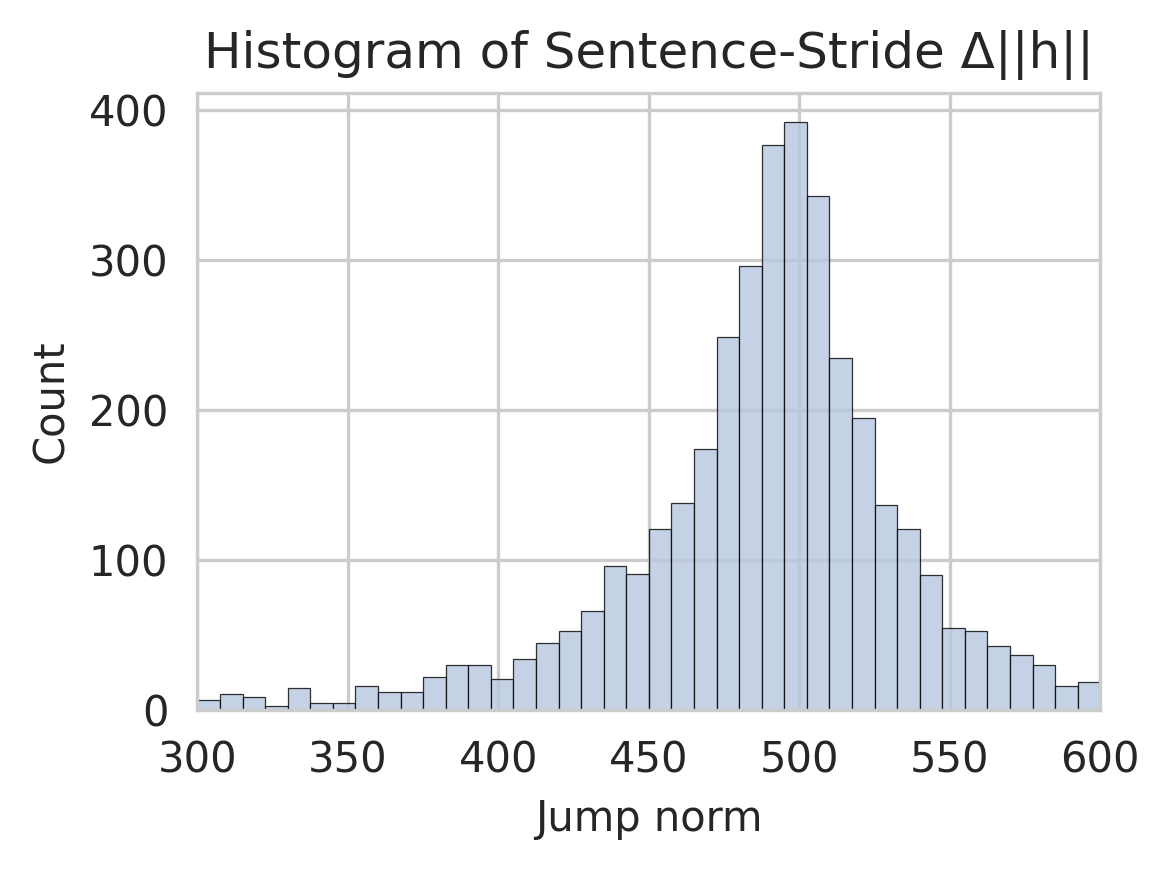
The image displays a histogram visualizing the distribution of "Sentence-Stride Δ||h||" values, measured as "Jump norm" on the x-axis and "Count" on the y-axis. The data forms a bell-shaped curve centered around 500, with counts decreasing symmetrically toward the edges of the range (300–600).
### Components/Axes
- **Title**: "Histogram of Sentence-Stride Δ||h||"
- **X-axis (Jump norm)**:
- Range: 300 to 600
- Increment: 50 (labels at 300, 350, 400, 450, 500, 550, 600)
- **Y-axis (Count)**:
- Range: 0 to 400
- Increment: 100 (labels at 0, 100, 200, 300, 400)
- **Bars**: Gray-blue, uniform width, no legend present.
### Detailed Analysis
- **Peak**: The tallest bar occurs at **Jump norm = 500**, with a count of approximately **400**.
- **Symmetry**: The distribution is roughly symmetric around 500, with counts decreasing as the Jump norm moves away from the center.
- **Left Tail (300–500)**:
- Counts rise gradually from ~10 (at 300) to ~400 (at 500).
- Notable increase between 400–500 (e.g., ~100 at 450, ~250 at 475).
- **Right Tail (500–600)**:
- Counts decline from ~400 (at 500) to ~20 (at 600).
- Steeper drop between 500–550 (~300 at 525, ~100 at 550).
- **Edge Values**:
- At 300 and 600, counts are minimal (~10–20).
### Key Observations
1. **Central Tendency**: The data is concentrated around **500**, suggesting this is the most common Jump norm value.
2. **Spread**: Values range from **300 to 600**, with 95% of data likely within **400–600** (based on the bell curve).
3. **Asymmetry in Tails**: The left tail (300–500) has a slower rise compared to the sharper decline on the right tail (500–600).
### Interpretation
The histogram indicates a **normal-like distribution** of Sentence-Stride Δ||h|| values, with a strong central tendency at 500. This suggests that most sentence-stride differences cluster around this value, with diminishing frequency as deviations increase. The symmetry implies balanced variability in both directions, though the left tail’s gradual rise may hint at a slight skew or data truncation. The peak at 500 could reflect an optimal or typical sentence-stride length in the analyzed dataset, while the broader range (300–600) highlights variability in sentence structure or stride patterns.