## Histogram: Histogram of Sentence-Stride Δ||h||
### Overview
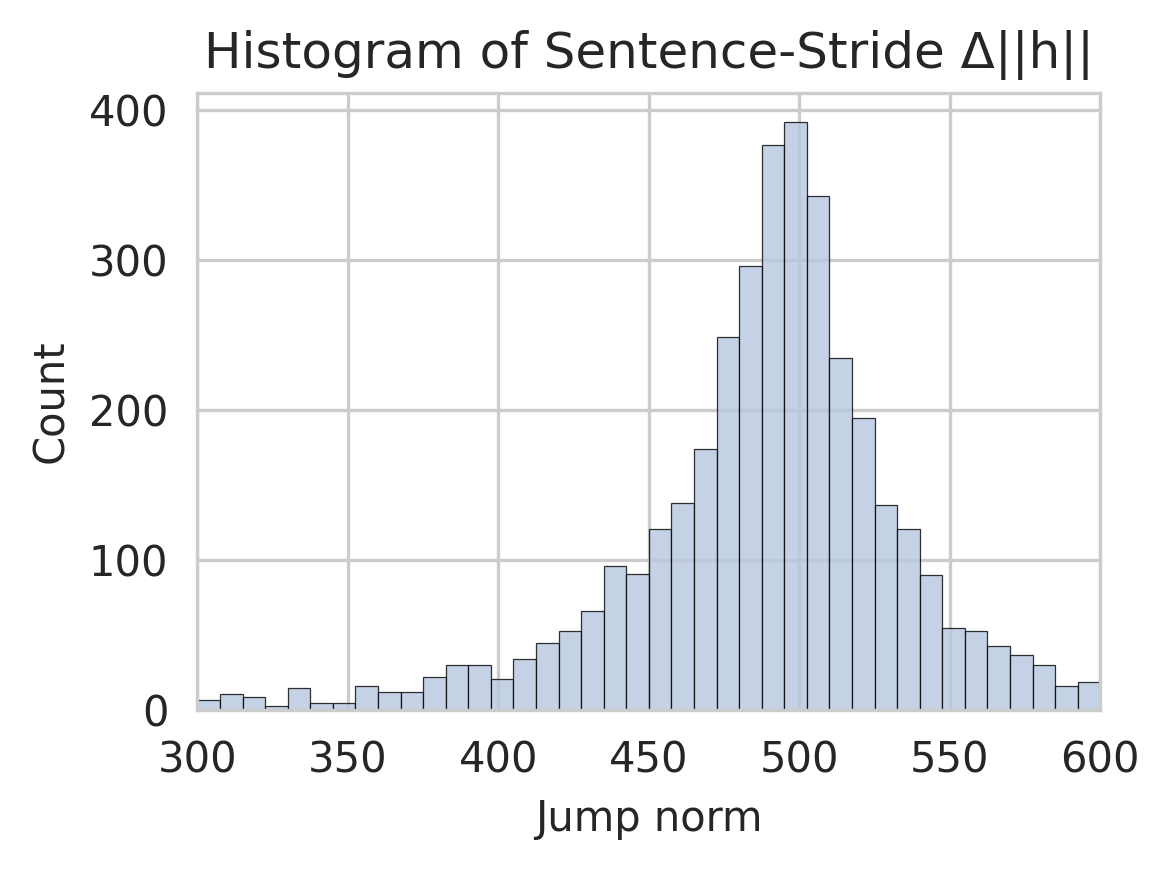
The image is a histogram displaying the distribution of "Sentence-Stride Δ||h||" values. The x-axis represents the "Jump norm," and the y-axis represents the "Count" or frequency of each jump norm value. The histogram shows a distribution that is skewed to the right, with a peak around a jump norm of 500.
### Components/Axes
* **Title:** Histogram of Sentence-Stride Δ||h||
* **X-axis:**
* Label: Jump norm
* Scale: 300 to 600, with tick marks at intervals of 50 (300, 350, 400, 450, 500, 550, 600)
* **Y-axis:**
* Label: Count
* Scale: 0 to 400, with tick marks at intervals of 100 (0, 100, 200, 300, 400)
* **Bars:** The histogram consists of vertical bars, each representing the frequency of a particular "Jump norm" range. The bars are light blue with dark blue outlines.
### Detailed Analysis
The histogram's bars represent the frequency of "Jump norm" values. Here's a breakdown of the approximate counts for different ranges:
* **300-350:** Count is approximately 10.
* **350-400:** Count is approximately 20.
* **400-450:** Count gradually increases from approximately 30 to 60.
* **450-500:** Count increases sharply from approximately 70 to a peak of approximately 390.
* **500-550:** Count decreases sharply from approximately 390 to approximately 60.
* **550-600:** Count decreases gradually from approximately 50 to approximately 20.
### Key Observations
* The distribution is unimodal, with a single peak.
* The peak of the distribution occurs around a "Jump norm" of 500, indicating that this is the most frequent sentence stride.
* The distribution is skewed to the right, meaning that there are more smaller "Jump norm" values than larger ones.
* The frequency of "Jump norm" values drops off more gradually to the right of the peak than to the left.
### Interpretation
The histogram visualizes the distribution of sentence stride lengths, as measured by the "Jump norm." The data suggests that sentence strides tend to cluster around a norm of 500, but there is a significant amount of variability. The right skew indicates that while most sentences have relatively short strides, there are some sentences with much longer strides, which pull the average stride length higher. This could be due to various factors, such as sentence complexity, topic changes, or stylistic choices. The histogram provides a useful overview of the typical sentence stride characteristics in the analyzed text.