\n
## Histogram: Histogram of Sentence-Stride Δ||h||
### Overview
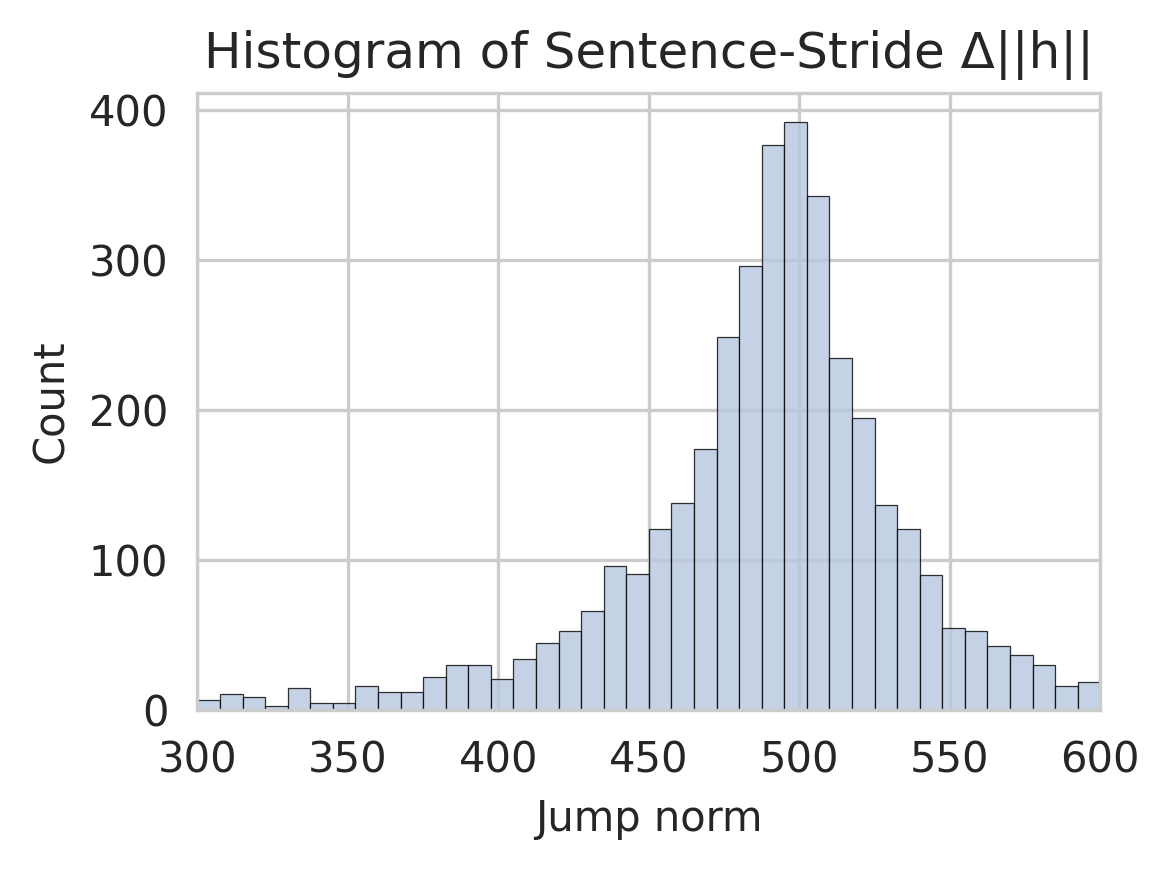
The image presents a histogram visualizing the distribution of "Sentence-Stride Δ||h||" values. The histogram displays the frequency (Count) of different values along the "Jump norm" axis. The distribution appears approximately normal, centered around a value of approximately 500.
### Components/Axes
* **Title:** "Histogram of Sentence-Stride Δ||h||" - positioned at the top-center of the image.
* **X-axis Label:** "Jump norm" - positioned at the bottom-center of the image. The scale ranges from approximately 300 to 600, with tick marks at intervals of 50.
* **Y-axis Label:** "Count" - positioned at the left-center of the image. The scale ranges from 0 to 400, with tick marks at intervals of 100.
* **Histogram Bars:** Represent the frequency of values within specific bins. The bars are filled with a light blue color.
### Detailed Analysis
The histogram shows a roughly symmetrical distribution. The highest frequency (peak) occurs around a "Jump norm" value of approximately 500, with a count of around 375.
Here's a breakdown of approximate counts for different "Jump norm" ranges:
* 300-350: Count ≈ 10
* 350-400: Count ≈ 20
* 400-450: Count ≈ 50
* 450-500: Count ≈ 150
* 500-550: Count ≈ 375
* 550-600: Count ≈ 100
The distribution decreases in frequency as we move away from the peak at 500 in both directions. The bars on the left side (below 450) are generally shorter than those on the right side (above 550), suggesting a slight skewness.
### Key Observations
* The distribution is unimodal, with a single prominent peak.
* The majority of "Sentence-Stride Δ||h||" values fall within the range of 400 to 600.
* There is a relatively small number of values below 400.
* The distribution appears to be approximately normally distributed.
### Interpretation
The histogram suggests that the "Sentence-Stride Δ||h||" metric tends to cluster around a value of 500. This could indicate a typical or expected value for this metric within the dataset. The spread of the distribution (as indicated by the width of the histogram) provides information about the variability of the metric. A narrower distribution would suggest less variability, while a wider distribution would suggest more.
The metric "Sentence-Stride Δ||h||" is not defined in the image, but the distribution provides insight into its behavior. The fact that it is normally distributed suggests that it may be the result of a combination of many independent factors. The peak at 500 could represent a baseline or average value, and deviations from this value could be interpreted as variations or anomalies.
Without further context, it's difficult to determine the specific meaning of this metric or the implications of its distribution. However, the histogram provides a valuable visual summary of the data and can be used to identify patterns and trends.