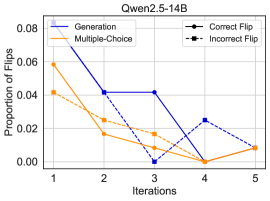
## Chart: Qwen2.5-14B Flips Proportion vs Iterations
### Overview
The image is a line chart comparing the proportion of flips across iterations for different methods (Generation, Multiple-Choice) and flip types (Correct Flip, Incorrect Flip) using the Qwen2.5-14B model. The x-axis represents iterations (1 to 5), and the y-axis represents the proportion of flips.
### Components/Axes
* **Title:** Qwen2.5-14B
* **X-axis:** Iterations (1, 2, 3, 4, 5)
* **Y-axis:** Proportion of Flips (0.00 to 0.08, incrementing by 0.02)
* **Legend (Top-Left):**
* Generation (Solid Blue Line)
* Multiple-Choice (Solid Orange Line)
* **Legend (Top-Right):**
* Correct Flip (Solid Black Line with Circle Markers)
* Incorrect Flip (Dashed Black Line with Square Markers)
### Detailed Analysis
**1. Generation (Solid Blue Line):**
* Trend: Decreases from iteration 1 to 3, remains constant from iteration 2 to 3, then decreases to iteration 4, then increases to iteration 5.
* Data Points:
* Iteration 1: ~0.072
* Iteration 2: ~0.042
* Iteration 3: ~0.042
* Iteration 4: ~0.00
* Iteration 5: ~0.025
**2. Multiple-Choice (Solid Orange Line):**
* Trend: Decreases from iteration 1 to 4, then increases slightly to iteration 5.
* Data Points:
* Iteration 1: ~0.058
* Iteration 2: ~0.017
* Iteration 3: ~0.008
* Iteration 4: ~0.00
* Iteration 5: ~0.008
**3. Correct Flip (Solid Black Line with Circle Markers):**
* Trend: Decreases from iteration 1 to 3, then increases to iteration 5.
* Data Points:
* Iteration 1: ~0.042
* Iteration 2: ~0.028
* Iteration 3: ~0.017
* Iteration 4: ~0.00
* Iteration 5: ~0.008
**4. Incorrect Flip (Dashed Black Line with Square Markers):**
* Trend: Decreases from iteration 1 to 4, then increases to iteration 5.
* Data Points:
* Iteration 1: ~0.042
* Iteration 2: ~0.028
* Iteration 3: ~0.017
* Iteration 4: ~0.00
* Iteration 5: ~0.008
### Key Observations
* The "Generation" method starts with a higher proportion of flips compared to "Multiple-Choice," but both converge to a low proportion by iteration 4.
* Both "Correct Flip" and "Incorrect Flip" start with similar proportions, decrease to near zero by iteration 4, and then slightly increase at iteration 5.
* Iteration 4 appears to be a point of significant reduction in the proportion of flips for all methods.
### Interpretation
The chart suggests that both the "Generation" and "Multiple-Choice" methods, along with "Correct Flip" and "Incorrect Flip", become more stable or accurate over iterations, as indicated by the decreasing proportion of flips. The convergence towards zero at iteration 4 implies a potential stabilization point in the model's learning or decision-making process. The slight increase at iteration 5 could indicate a minor adjustment or fluctuation in the model's behavior. The data demonstrates the impact of iterative refinement on the Qwen2.5-14B model's performance, highlighting the potential for improved accuracy with successive iterations.