\n
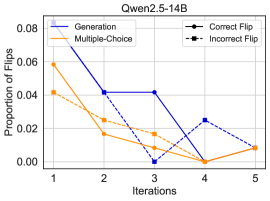
## Line Chart: Proportion of Flips vs. Iterations (Qwen2.5-14B)
### Overview
This line chart depicts the proportion of flips observed across different iterations for two methods: Generation and Multiple-Choice, and further categorized into Correct Flip and Incorrect Flip. The chart aims to illustrate how the frequency of flips changes as the process iterates. The title "Qwen2.5-14B" suggests this data relates to a model or experiment using that specific configuration.
### Components/Axes
* **X-axis:** Iterations (labeled 1 to 5).
* **Y-axis:** Proportion of Flips (scale from 0.00 to 0.08).
* **Legend:** Located in the top-right corner.
* **Generation:** Solid Blue Line
* **Multiple-Choice:** Solid Orange Line
* **Correct Flip:** Black Dashed Line
* **Incorrect Flip:** Black Solid Line
### Detailed Analysis
The chart displays four distinct lines representing the proportion of flips for each category.
* **Generation (Blue Line):** Starts at approximately 0.07, sharply decreases to around 0.04 at iteration 2, remains relatively stable at around 0.04 until iteration 3, then drops to approximately 0.00 at iteration 3, rises to around 0.02 at iteration 4, and finally increases to approximately 0.03 at iteration 5.
* **Multiple-Choice (Orange Line):** Begins at approximately 0.06, steadily declines to around 0.02 at iteration 2, continues to decrease to approximately 0.01 at iteration 4, and then slightly increases to around 0.02 at iteration 5.
* **Correct Flip (Black Dashed Line):** Starts at approximately 0.04, decreases to around 0.02 at iteration 2, remains relatively stable at around 0.02 until iteration 4, and then increases to approximately 0.03 at iteration 5.
* **Incorrect Flip (Black Solid Line):** Starts at approximately 0.04, decreases to around 0.02 at iteration 2, remains relatively stable at around 0.02 until iteration 3, then drops to approximately 0.00 at iteration 3, rises to around 0.02 at iteration 4, and finally increases to approximately 0.03 at iteration 5.
Here's a more detailed breakdown of approximate values at each iteration:
| Iteration | Generation | Multiple-Choice | Correct Flip | Incorrect Flip |
|---|---|---|---|---|
| 1 | 0.07 | 0.06 | 0.04 | 0.04 |
| 2 | 0.04 | 0.02 | 0.02 | 0.02 |
| 3 | 0.00 | 0.01 | 0.02 | 0.00 |
| 4 | 0.02 | 0.01 | 0.02 | 0.02 |
| 5 | 0.03 | 0.02 | 0.03 | 0.03 |
### Key Observations
* The "Generation" method exhibits a significant drop in the proportion of flips around iteration 3, reaching a minimum.
* The "Multiple-Choice" method shows a more gradual and consistent decline in the proportion of flips across all iterations.
* Both "Correct Flip" and "Incorrect Flip" lines remain relatively low throughout the iterations.
* The "Generation" and "Incorrect Flip" lines show a similar trend, decreasing sharply at iteration 3 and then increasing slightly in the final iterations.
### Interpretation
The data suggests that the "Generation" method undergoes a more substantial change in its flip behavior compared to the "Multiple-Choice" method. The sharp decrease in flips for "Generation" at iteration 3 could indicate a convergence or stabilization of the process, or potentially a point where the model starts to perform better. The "Multiple-Choice" method, on the other hand, demonstrates a more consistent and gradual improvement. The relatively low proportion of "Correct Flips" suggests that flips, in general, are more often incorrect, indicating a need for further refinement or optimization of the process. The fact that the "Generation" and "Incorrect Flip" lines mirror each other suggests that the flips are primarily incorrect, and the reduction in flips corresponds to a reduction in incorrect flips. The model "Qwen2.5-14B" appears to be undergoing a process where the frequency of flips is being reduced over iterations, with the "Generation" method showing a more dramatic change than the "Multiple-Choice" method. This could be related to a learning process or an optimization algorithm.