## Bar Chart: Model Performance Comparison: Generation vs. Multiple-choice Accuracy
### Overview
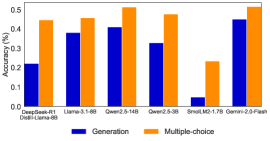
The chart compares the accuracy of six AI models (DeepSeek-R1, Llama-3-1.8B, Qwen2.5-14B, Qwen2.5-3B, SmolLM2-1.7B, Gemini-2.0-Flash) across two tasks: **Generation** (blue bars) and **Multiple-choice** (orange bars). Accuracy is measured on a 0–0.5 scale, with higher values indicating better performance.
### Components/Axes
- **X-axis**: Model names (DeepSeek-R1, Llama-3-1.8B, Qwen2.5-14B, Qwen2.5-3B, SmolLM2-1.7B, Gemini-2.0-Flash), ordered left to right.
- **Y-axis**: Accuracy (%) from 0.0 to 0.5 in increments of 0.1.
- **Legend**:
- Blue = Generation
- Orange = Multiple-choice
- **Bar Placement**: For each model, two bars are grouped side-by-side (blue left, orange right).
### Detailed Analysis
1. **DeepSeek-R1**:
- Generation: ~0.22
- Multiple-choice: ~0.45
2. **Llama-3-1.8B**:
- Generation: ~0.38
- Multiple-choice: ~0.46
3. **Qwen2.5-14B**:
- Generation: ~0.41
- Multiple-choice: ~0.52
4. **Qwen2.5-3B**:
- Generation: ~0.33
- Multiple-choice: ~0.48
5. **SmolLM2-1.7B**:
- Generation: ~0.05
- Multiple-choice: ~0.23
6. **Gemini-2.0-Flash**:
- Generation: ~0.45
- Multiple-choice: ~0.52
### Key Observations
- **Multiple-choice consistently outperforms Generation** across all models (orange bars are taller than blue bars).
- **Gemini-2.0-Flash** achieves the highest accuracy in both tasks (~0.45 for Generation, ~0.52 for Multiple-choice).
- **SmolLM2-1.7B** has the lowest performance, particularly in Generation (~0.05).
- The **performance gap** between tasks varies: Gemini-2.0-Flash has a 0.07 difference, while SmolLM2-1.7B has a 0.18 difference.
### Interpretation
The data suggests that **Multiple-choice tasks are structurally easier** for these models than open-ended Generation tasks. This aligns with the hypothesis that models excel at pattern recognition in constrained formats (e.g., selecting from predefined options) but struggle with creative or context-dependent outputs. Gemini-2.0-Flash’s dominance in both categories indicates superior architectural design or training data quality. Conversely, SmolLM2-1.7B’s poor Generation performance highlights limitations in handling unstructured tasks, possibly due to smaller model size or less robust training. The trend underscores the need for specialized architectures to bridge the gap between task types.