## System Diagram: AI Learning and Retention
### Overview
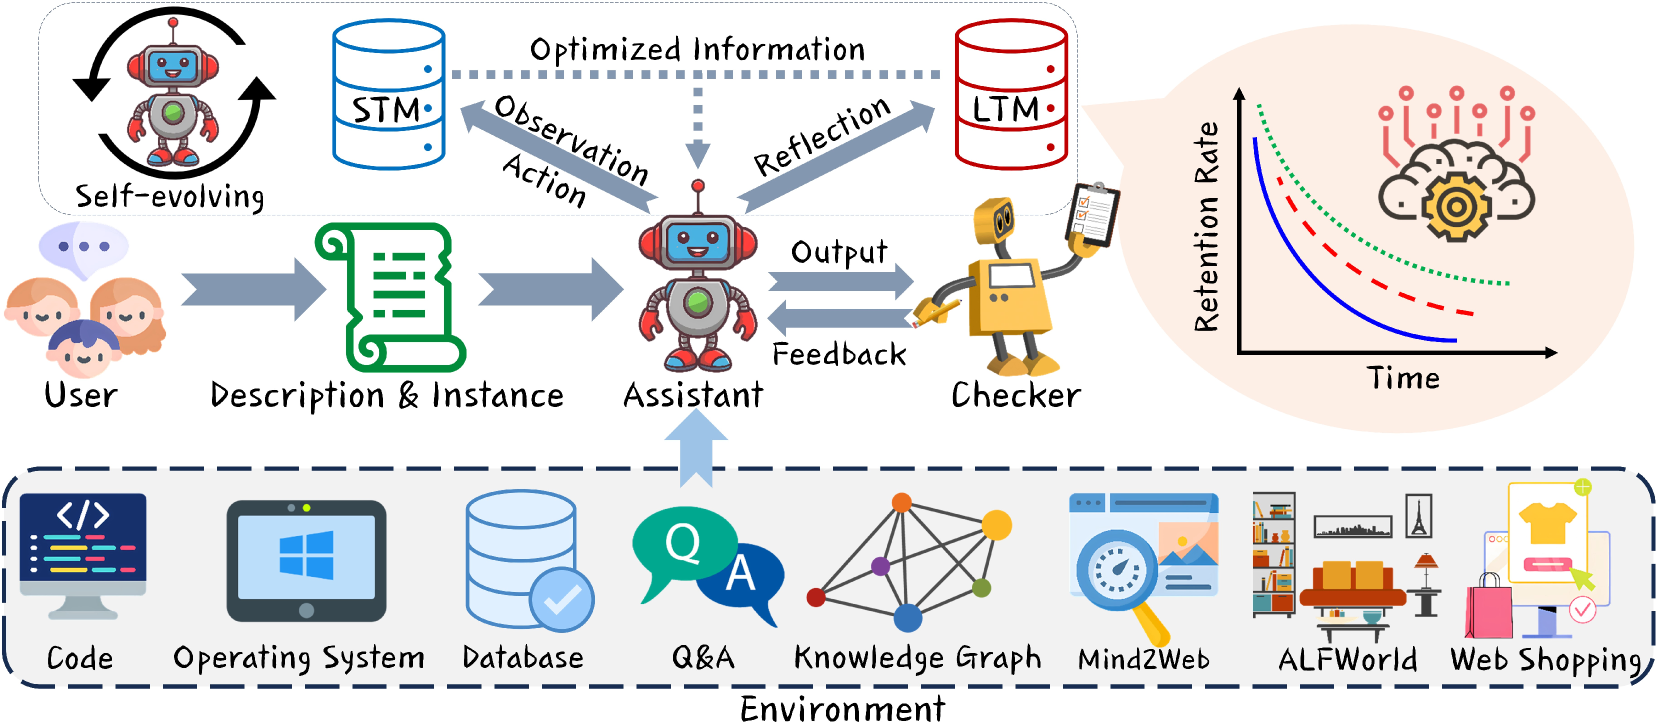
The image is a system diagram illustrating an AI learning and retention process. It depicts the flow of information and interactions between different components, including a user, an assistant AI, a checker, and the environment. The diagram also includes a graph showing retention rates over time.
### Components/Axes
* **Actors:** User, Assistant, Checker
* **Data Stores:** STM (Short-Term Memory), LTM (Long-Term Memory)
* **Processes:** Self-evolving, Observation, Action, Reflection, Output, Feedback
* **Environment:** Code, Operating System, Database, Q&A, Knowledge Graph, Mind2Web, ALFWorld, Web Shopping
* **Chart Axes:**
* X-axis: Time
* Y-axis: Retention Rate
* **Chart Data Series:**
* Blue line: Steep initial decline, then plateaus at a low retention rate.
* Red dashed line: Moderate initial decline, plateaus at a medium retention rate.
* Green dotted line: Gradual initial decline, plateaus at a high retention rate.
### Detailed Analysis
* **User Interaction:** The process begins with a user providing a "Description & Instance" to the system.
* **Assistant AI:** The "Assistant" AI observes and acts based on the input, interacting with STM and LTM for optimized information.
* **Checker:** The "Checker" evaluates the output of the Assistant AI and provides feedback.
* **Self-Evolving Loop:** The AI undergoes a self-evolving process, suggesting continuous learning and improvement.
* **Environment:** The AI interacts with various elements in the environment, including code, operating systems, databases, Q&A systems, knowledge graphs, and web applications.
* **Retention Rate Chart:** The chart shows three different retention rate curves over time. All three curves show a decline in retention rate as time increases, but the rate of decline and the final retention rate vary.
### Key Observations
* The diagram emphasizes the iterative nature of the AI learning process, with feedback loops and continuous self-evolution.
* The retention rate chart suggests that different learning strategies or types of information may lead to different retention outcomes.
* The environment plays a crucial role in the AI's learning and application, providing diverse data sources and interaction opportunities.
### Interpretation
The diagram illustrates a comprehensive AI learning system that incorporates user input, internal memory structures (STM and LTM), external environment interaction, and a feedback mechanism for continuous improvement. The retention rate chart highlights the importance of optimizing learning strategies to maximize long-term retention. The system aims to create an AI assistant capable of learning, adapting, and performing tasks effectively within a complex environment. The different retention curves could represent different learning methods, data types, or individual AI performance characteristics. The blue line could represent rote memorization, the red line spaced repetition, and the green line contextual learning.