## Diagram: AI System Architecture & Retention Rate
### Overview
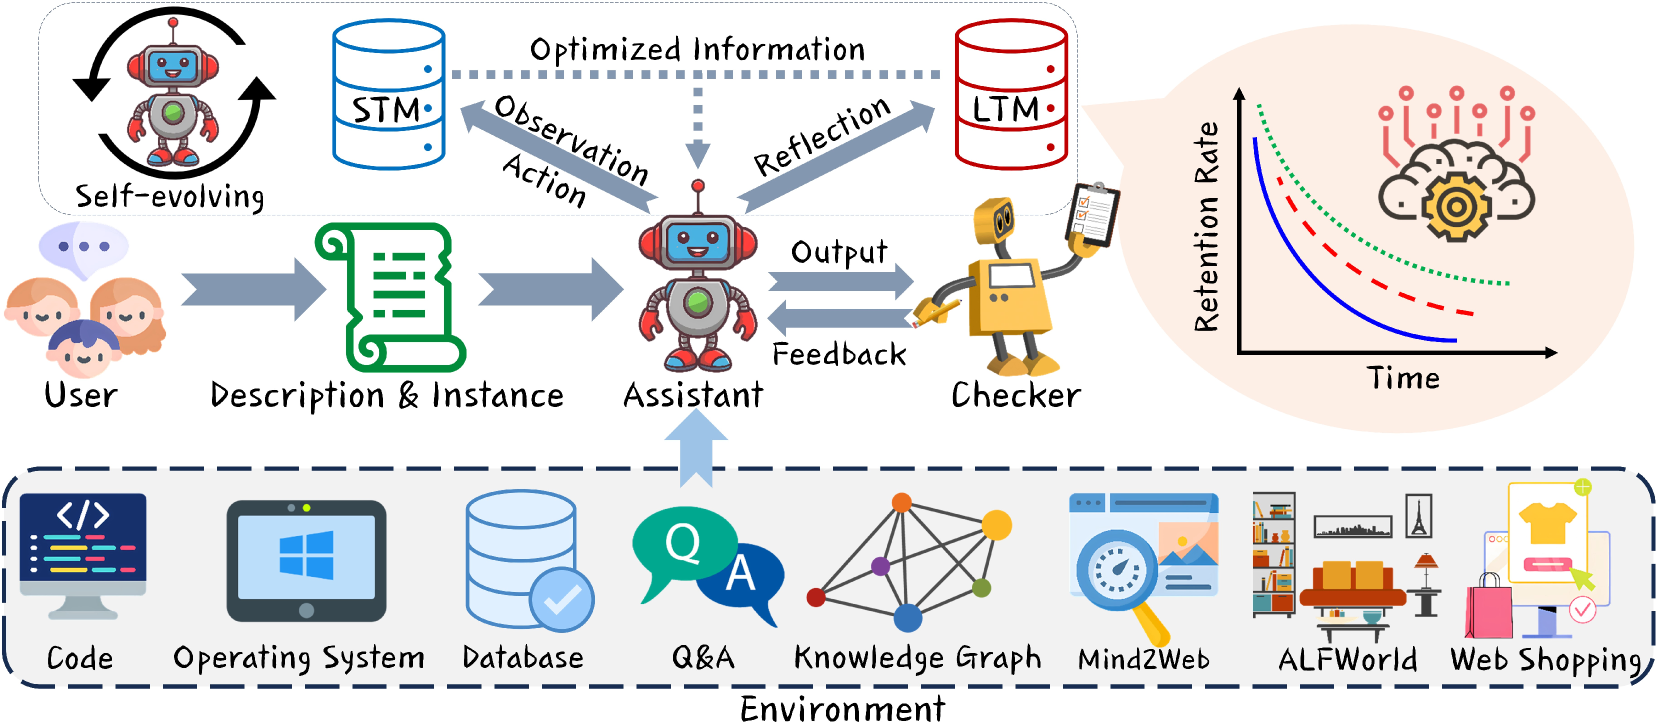
The image depicts a diagram of an AI system architecture, illustrating the flow of information from a user to an assistant, through various processing stages, and ultimately to a checker, alongside a graph showing retention rate over time. The system is grounded in an "Environment" consisting of various computational resources.
### Components/Axes
The diagram is segmented into three main regions: a user interaction and processing flow (top), a retention rate graph (right), and the underlying environment (bottom).
* **User Interaction & Processing Flow:** Includes components labeled "User", "Description & Instance", "Assistant", "Checker", "STM" (Short-Term Memory), "LTM" (Long-Term Memory). Arrows indicate the direction of information flow.
* **Retention Rate Graph:** X-axis labeled "Time". Y-axis labeled "Retention Rate". Three lines are plotted representing different retention rates.
* **Environment:** Includes components labeled "Code", "Operating System", "Database", "Q&A", "Knowledge Graph", "Mind2Web", "ALFWorld", "Web Shopping".
* **Labels:** "Optimized Information", "Observation Action", "Reflection", "Output", "Feedback", "Self-evolving", "Environment".
### Detailed Analysis or Content Details
**User Interaction & Processing Flow:**
1. **User:** Represented by a head silhouette with speech bubbles, indicating input.
2. **Description & Instance:** A cylindrical component with a document inside, receiving input from the user.
3. **Assistant:** A robot icon receiving input from "Description & Instance". Arrows indicate "Observation Action" and "Reflection" flowing from the Assistant to "STM" and "LTM" respectively. An "Output" arrow flows from the Assistant to the "Checker".
4. **Checker:** A robot icon with a checklist, receiving "Feedback" from the Assistant.
5. **STM (Short-Term Memory):** A blue cylinder.
6. **LTM (Long-Term Memory):** A red cylinder.
7. **Self-evolving:** A robot icon with a circular arrow around it, positioned above the "User".
**Retention Rate Graph:**
* **Green Line:** Starts at approximately 0.8 on the Retention Rate axis at the beginning of the Time axis, and gradually decreases to approximately 0.4. This line represents a relatively high and slowly declining retention rate.
* **Red Dashed Line:** Starts at approximately 0.6 on the Retention Rate axis, and declines more rapidly to approximately 0.2. This line represents a faster decline in retention.
* **Blue Dotted Line:** Starts at approximately 0.4 on the Retention Rate axis, and declines at a moderate rate to approximately 0.1. This line represents a moderate decline in retention.
**Environment:**
* **Code:** Represented by `< />` brackets.
* **Operating System:** Represented by a Windows logo.
* **Database:** Represented by a cylinder.
* **Q&A:** Represented by a question mark inside a speech bubble.
* **Knowledge Graph:** Represented by a network of interconnected nodes.
* **Mind2Web:** Represented by a clock.
* **ALFWorld:** Represented by a scene with a table, a lamp, and other objects.
* **Web Shopping:** Represented by a shopping cart and a computer screen.
### Key Observations
* The system architecture emphasizes a cyclical process of observation, action, reflection, and feedback.
* The retention rate graph shows that all three retention rates decline over time, but at different rates. The green line indicates the most stable retention, while the red dashed line shows the most rapid decline.
* The "Environment" section highlights the diverse computational resources that support the AI system.
* The "Self-evolving" component suggests the system is capable of learning and improving over time.
### Interpretation
The diagram illustrates a sophisticated AI system designed for processing user input, generating outputs, and continuously improving through feedback and learning. The system leverages both short-term and long-term memory to optimize information processing. The retention rate graph suggests that the effectiveness of the system (or the user's ability to retain information provided by the system) diminishes over time, but the rate of decline can vary. The diverse "Environment" components indicate that the system is capable of interacting with a wide range of data sources and applications.
The cyclical nature of the processing flow (User -> Description -> Assistant -> Checker -> Feedback) suggests a reinforcement learning approach, where the system learns from its mistakes and refines its outputs over time. The "Self-evolving" component reinforces this idea. The different retention rates could represent different types of information or different user groups, with some information being more easily retained than others. The diagram suggests a system designed for complex tasks requiring continuous learning and adaptation.