## Diagram: Self-Evolving System Architecture with Feedback Loops and Retention Analysis
### Overview
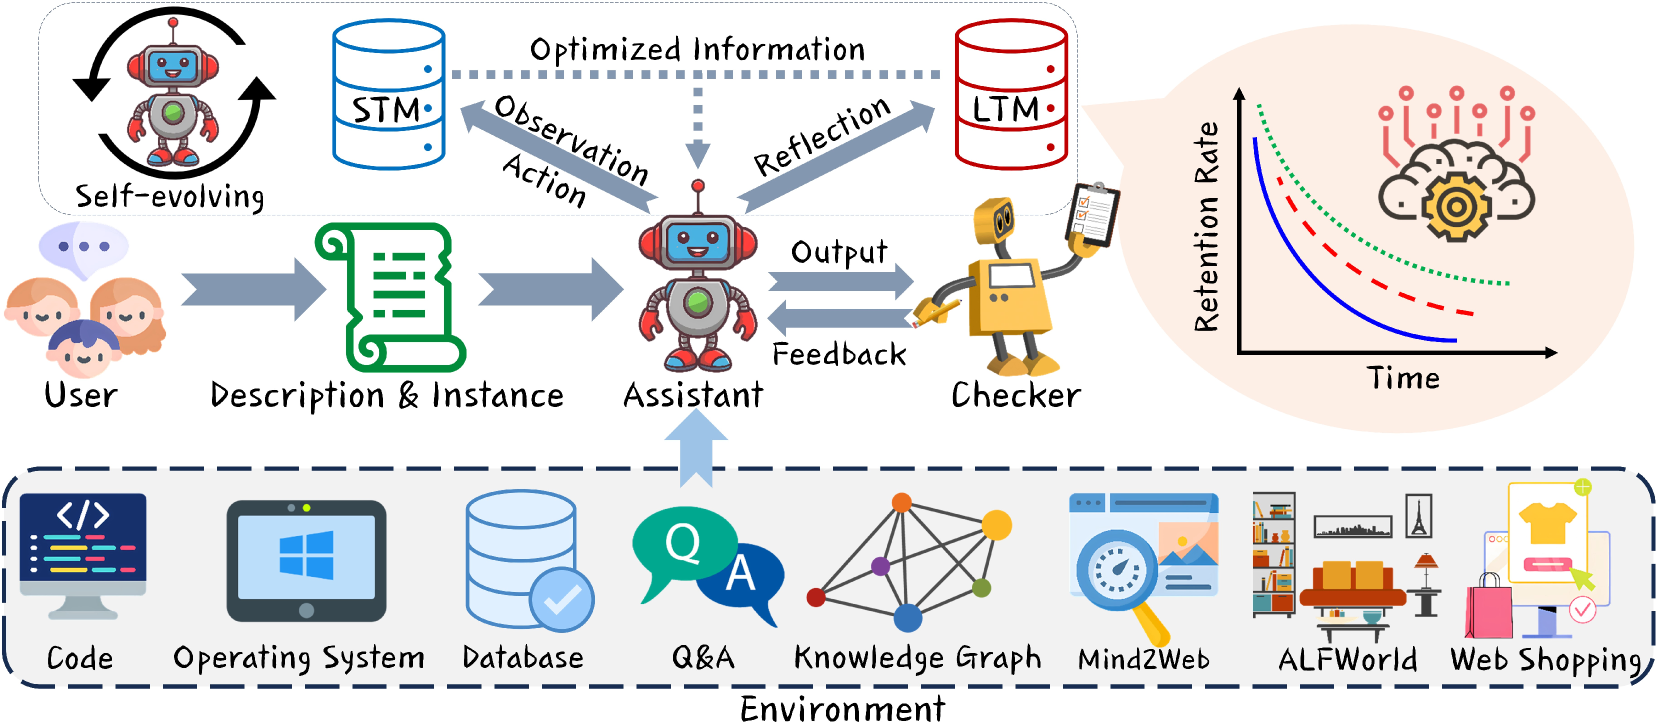
The diagram illustrates a dynamic system architecture centered around a self-evolving robot (STM) that interacts with users, processes descriptions/instances, and generates optimized information. Key components include feedback loops, a checker mechanism, and a retention rate analysis graph. The system integrates multiple environments (code, databases, Q&A, etc.) and emphasizes iterative improvement through observation, action, and reflection.
---
### Components/Axes
1. **Core System**:
- **STM (Self-Evolving Robot)**: Central processing unit with a feedback loop to LTM (Long-Term Memory).
- **LTM (Long-Term Memory)**: Stores optimized information.
- **User**: Provides descriptions/instances via speech bubbles.
- **Assistant**: Processes user input and generates outputs.
- **Checker**: Validates outputs and provides feedback.
2. **Flow Arrows**:
- **Observation → Action → Reflection**: STM’s decision-making cycle.
- **Output ↔ Feedback**: Assistant-Checker interaction.
- **Retention Rate Graph**: Time (x-axis) vs. Retention Rate (y-axis) with three data series (blue, red, green).
3. **Environment**:
- **Code**, **Operating System**, **Database**, **Q&A**, **Knowledge Graph**, **Mind2Web**, **ALFWorld**, **Web Shopping**: Represented as icons at the bottom.
---
### Detailed Analysis
1. **STM-LTM Interaction**:
- STM receives "Optimized Information" from LTM via a dotted arrow, indicating iterative refinement.
- STM outputs observations/actions, which are reflected back to LTM.
2. **User-Assistant-Checker Loop**:
- Users submit descriptions/instances (green scroll icon).
- Assistant generates outputs, which the Checker validates (clipboard icon).
- Feedback is sent back to STM for adjustments.
3. **Retention Rate Graph**:
- **X-axis**: Time (left to right).
- **Y-axis**: Retention Rate (bottom to top).
- **Data Series**:
- **Blue Line**: Steep decline, suggesting rapid decay.
- **Red Dashed Line**: Moderate decline.
- **Green Dotted Line**: Slowest decline, implying highest retention.
4. **Environment Components**:
- **Code**: Text editor icon (//).
- **Operating System**: Windows logo.
- **Database**: Stacked cylinders with a checkmark.
- **Q&A**: Speech bubbles (Q/A).
- **Knowledge Graph**: Network of colored nodes.
- **Mind2Web**: Magnifying glass over a webpage.
- **ALFWorld**: Living room with books and a computer.
- **Web Shopping**: E-commerce interface with a shopping cart.
---
### Key Observations
1. **Feedback Dominance**: The STM-LTM feedback loop is central, emphasizing continuous learning.
2. **Checker’s Role**: Acts as a quality gatekeeper, ensuring outputs meet standards before feedback.
3. **Retention Trends**:
- The green dotted line (highest retention) suggests long-term strategies outperform short-term ones.
- The blue line’s sharp drop may indicate volatile or unsustainable methods.
4. **Environment Integration**: The system relies on diverse environments (e.g., databases, knowledge graphs) for functionality.
---
### Interpretation
1. **System Adaptability**: The self-evolving STM and feedback loops highlight a focus on iterative improvement, akin to machine learning systems.
2. **Retention Strategy**: The green line’s performance implies that gradual, consistent approaches (e.g., knowledge graphs, Q&A) yield better long-term outcomes than abrupt changes (blue line).
3. **User-Centric Design**: User input drives the system, with the Assistant and Checker ensuring alignment with user needs.
4. **Environment Synergy**: The integration of code, databases, and real-world simulations (ALFWorld, Web Shopping) suggests a hybrid digital-physical operational framework.
**Critical Insight**: The diagram positions the Checker as a pivotal component, bridging raw output and refined feedback. Its absence would likely degrade system accuracy, as seen in the blue line’s poor retention. The green line’s success underscores the value of structured, incremental learning over reactive adjustments.