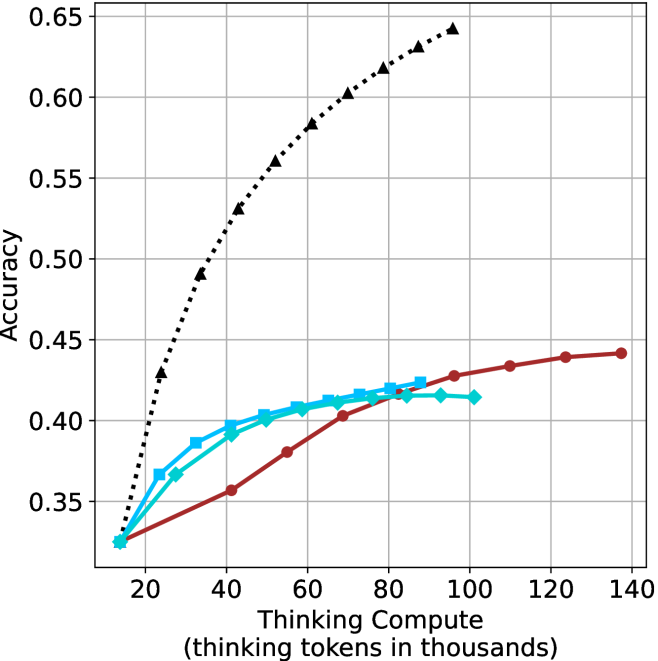
## Line Chart: Accuracy vs. Thinking Tokens
### Overview
This image presents a line chart illustrating the relationship between "Thinking Tokens" (in thousands) and "Accuracy". The chart displays three distinct data series, each represented by a different colored line, showing how accuracy changes as the number of thinking tokens increases. The chart has a grid background for easier readability.
### Components/Axes
* **X-axis Title:** "Thinking Compute (thinking tokens in thousands)"
* Scale: Ranges from approximately 0 to 140 (in thousands of tokens).
* Markers: 20, 40, 60, 80, 100, 120, 140
* **Y-axis Title:** "Accuracy"
* Scale: Ranges from approximately 0.30 to 0.65.
* Markers: 0.30, 0.35, 0.40, 0.45, 0.50, 0.55, 0.60, 0.65
* **Data Series:**
* Black dotted line: Represents a rapidly increasing accuracy.
* Cyan solid line: Represents a slower, more gradual increase in accuracy.
* Red solid line: Represents a relatively flat accuracy curve, with a slight increase at the end.
* **Legend:** No explicit legend is present, but the lines are visually distinguishable.
### Detailed Analysis
* **Black Line:** This line shows a steep upward trend.
* At approximately 20 thinking tokens, accuracy is around 0.32.
* At approximately 40 thinking tokens, accuracy is around 0.52.
* At approximately 60 thinking tokens, accuracy is around 0.58.
* At approximately 80 thinking tokens, accuracy is around 0.61.
* At approximately 100 thinking tokens, accuracy is around 0.62.
* At approximately 120 thinking tokens, accuracy is around 0.63.
* At approximately 140 thinking tokens, accuracy is around 0.64.
* **Cyan Line:** This line shows a more moderate upward trend.
* At approximately 20 thinking tokens, accuracy is around 0.34.
* At approximately 40 thinking tokens, accuracy is around 0.38.
* At approximately 60 thinking tokens, accuracy is around 0.40.
* At approximately 80 thinking tokens, accuracy is around 0.41.
* At approximately 100 thinking tokens, accuracy is around 0.42.
* At approximately 120 thinking tokens, accuracy is around 0.42.
* At approximately 140 thinking tokens, accuracy is around 0.43.
* **Red Line:** This line shows a relatively flat trend with a slight increase towards the end.
* At approximately 20 thinking tokens, accuracy is around 0.33.
* At approximately 40 thinking tokens, accuracy is around 0.36.
* At approximately 60 thinking tokens, accuracy is around 0.38.
* At approximately 80 thinking tokens, accuracy is around 0.40.
* At approximately 100 thinking tokens, accuracy is around 0.41.
* At approximately 120 thinking tokens, accuracy is around 0.42.
* At approximately 140 thinking tokens, accuracy is around 0.44.
### Key Observations
* The black line demonstrates significantly higher accuracy gains with increasing thinking tokens compared to the cyan and red lines.
* The cyan and red lines show diminishing returns in accuracy as the number of thinking tokens increases.
* The red line exhibits the slowest rate of accuracy improvement.
### Interpretation
The chart suggests that increasing the number of "thinking tokens" (likely representing computational steps or processing time) has a positive correlation with accuracy, but the rate of improvement varies significantly depending on the data series. The black line indicates a highly effective process where more thinking tokens lead to substantial accuracy gains. The cyan and red lines suggest that, beyond a certain point, additional thinking tokens yield only marginal improvements in accuracy. This could indicate that these processes reach a point of diminishing returns or are limited by other factors. The differences between the lines could represent different algorithms, model architectures, or optimization strategies. The chart highlights the importance of optimizing the "thinking compute" to maximize accuracy gains, and suggests that for some processes, there may be an optimal point beyond which further computation is not beneficial.