## Line Graph: Accuracy vs. Thinking Compute (Tokens in Thousands)
### Overview
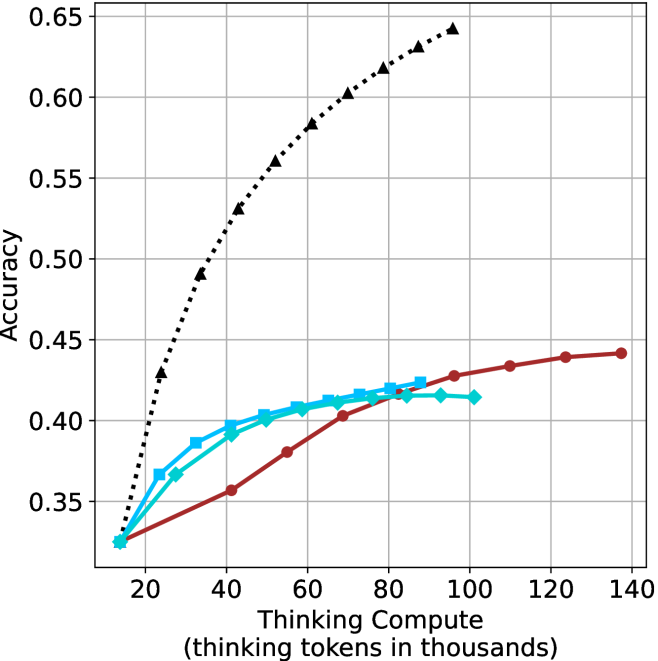
The image depicts a line graph comparing the accuracy of three models (Model A, Model B, Model C) across varying levels of thinking compute, measured in thousands of tokens. The x-axis represents compute scale (20k to 140k tokens), and the y-axis represents accuracy (0.35 to 0.65). Three distinct data series are plotted with different line styles and colors.
### Components/Axes
- **X-axis**: "Thinking Compute (thinking tokens in thousands)"
- Scale: 20 → 140 (in thousands of tokens)
- Ticks: 20, 40, 60, 80, 100, 120, 140
- **Y-axis**: "Accuracy"
- Scale: 0.35 → 0.65 (increments of 0.05)
- Ticks: 0.35, 0.40, 0.45, 0.50, 0.55, 0.60, 0.65
- **Legend**: Top-right corner
- Model A: Black dotted line
- Model B: Red solid line
- Model C: Blue solid line
### Detailed Analysis
1. **Model A (Black Dotted Line)**
- **Trend**: Steep upward trajectory from (20k, 0.35) to (140k, 0.65).
- **Key Points**:
- At 20k tokens: ~0.35 accuracy
- At 40k tokens: ~0.45 accuracy
- At 60k tokens: ~0.50 accuracy
- At 80k tokens: ~0.55 accuracy
- At 100k tokens: ~0.60 accuracy
- At 120k tokens: ~0.62 accuracy
- At 140k tokens: ~0.65 accuracy
2. **Model B (Red Solid Line)**
- **Trend**: Gradual upward curve, plateauing near 0.44 accuracy.
- **Key Points**:
- At 20k tokens: ~0.35 accuracy
- At 40k tokens: ~0.38 accuracy
- At 60k tokens: ~0.40 accuracy
- At 80k tokens: ~0.42 accuracy
- At 100k tokens: ~0.43 accuracy
- At 120k tokens: ~0.44 accuracy
- At 140k tokens: ~0.44 accuracy
3. **Model C (Blue Solid Line)**
- **Trend**: Similar to Model B but slightly higher initial performance, plateauing at ~0.42 accuracy.
- **Key Points**:
- At 20k tokens: ~0.35 accuracy
- At 40k tokens: ~0.39 accuracy
- At 60k tokens: ~0.41 accuracy
- At 80k tokens: ~0.42 accuracy
- At 100k tokens: ~0.42 accuracy
- At 120k tokens: ~0.42 accuracy
- At 140k tokens: ~0.42 accuracy
### Key Observations
- **Model A** demonstrates the strongest positive correlation between compute and accuracy, achieving near-maximal performance (0.65) at 140k tokens.
- **Models B and C** exhibit diminishing returns, with accuracy gains slowing significantly after 80k tokens.
- **Model C** plateaus earlier (at 100k tokens) compared to Model B, suggesting a lower upper bound for its performance.
- All models start at identical accuracy (0.35) at 20k tokens, indicating baseline performance parity at minimal compute.
### Interpretation
The data suggests that **Model A** scales more effectively with increased compute resources, achieving higher accuracy gains across the token range. In contrast, **Models B and C** show limited scalability, with accuracy improvements plateauing at lower compute thresholds. This could imply architectural or algorithmic constraints in Models B and C, such as inefficiencies in token utilization or model capacity. The stark divergence between Model A and the others highlights the importance of compute efficiency in achieving high performance. Notably, the plateau in Model C’s accuracy at 100k tokens may indicate a "saturation point" where additional compute yields negligible benefits, a critical consideration for resource allocation in large-scale training.