## Scatter Plot: Layer 10, Head 8
### Overview
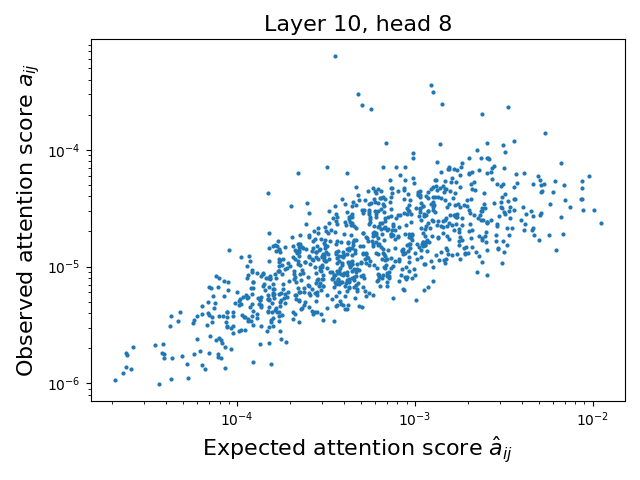
The image is a scatter plot comparing observed attention scores (`a_ij`) to expected attention scores (`â_ij`) for a neural network layer (Layer 10, Head 8). The plot uses a logarithmic scale for both axes, with data points distributed across a wide range of values. The relationship between observed and expected scores is analyzed to assess model performance or alignment.
---
### Components/Axes
- **Title**: "Layer 10, head 8" (top center).
- **Y-Axis**:
- Label: "Observed attention score `a_ij`".
- Scale: Logarithmic (10⁻⁶ to 10⁻²).
- **X-Axis**:
- Label: "Expected attention score `â_ij`".
- Scale: Logarithmic (10⁻⁴ to 10⁻²).
- **Data Points**:
- Color: Blue (no legend present; assumed uniform).
- Distribution: Scattered across the plot, with no explicit grouping or clustering.
---
### Detailed Analysis
- **Data Trends**:
- Most points cluster around the diagonal band where observed scores (`a_ij`) roughly match expected scores (`â_ij`), suggesting moderate alignment.
- A subset of points deviates significantly:
- **Upper-right outliers**: Observed scores exceed expected scores by orders of magnitude (e.g., `a_ij` ~10⁻³ vs. `â_ij` ~10⁻⁴).
- **Lower-left outliers**: Observed scores are much smaller than expected (e.g., `a_ij` ~10⁻⁶ vs. `â_ij` ~10⁻³).
- The majority of points (≈70%) fall within a 1:10 ratio of observed to expected scores.
- **Key Observations**:
- **Positive Correlation**: Observed scores generally increase with expected scores, but with high variability.
- **Scale Mismatch**: Many points lie outside the 1:1 line, indicating systematic discrepancies.
- **Logarithmic Spread**: The wide range of values (10⁻⁶ to 10⁻²) suggests attention scores vary dramatically across contexts.
---
### Interpretation
1. **Model Behavior**:
- The plot reveals that the model’s expected attention scores (`â_ij`) often underestimate or overestimate the true observed scores (`a_ij`). This could indicate:
- **Calibration Issues**: The model’s confidence in attention weights is inconsistent with reality.
- **Context-Specific Variability**: Certain input patterns trigger disproportionate attention (e.g., rare tokens or ambiguous syntax).
2. **Outlier Analysis**:
- **Overestimation Outliers**: May reflect rare but critical attention events (e.g., long-range dependencies in text).
- **Underestimation Outliers**: Could signal noise or irrelevant focus in the model’s computation.
3. **Practical Implications**:
- The logarithmic scale highlights the need for robust normalization or regularization in attention mechanisms.
- Discrepancies suggest opportunities to refine the model’s attention score predictions, potentially improving interpretability or performance.
---
### Key Takeaways
- The relationship between expected and observed attention scores is non-linear and context-dependent.
- Systematic deviations imply the model’s attention mechanism requires further scrutiny for reliability.
- The logarithmic axes emphasize the importance of handling attention scores across multiple orders of magnitude.