## Grouped Bar Chart: MR-Scores of Models on Different Reasoning Paradigms
### Overview
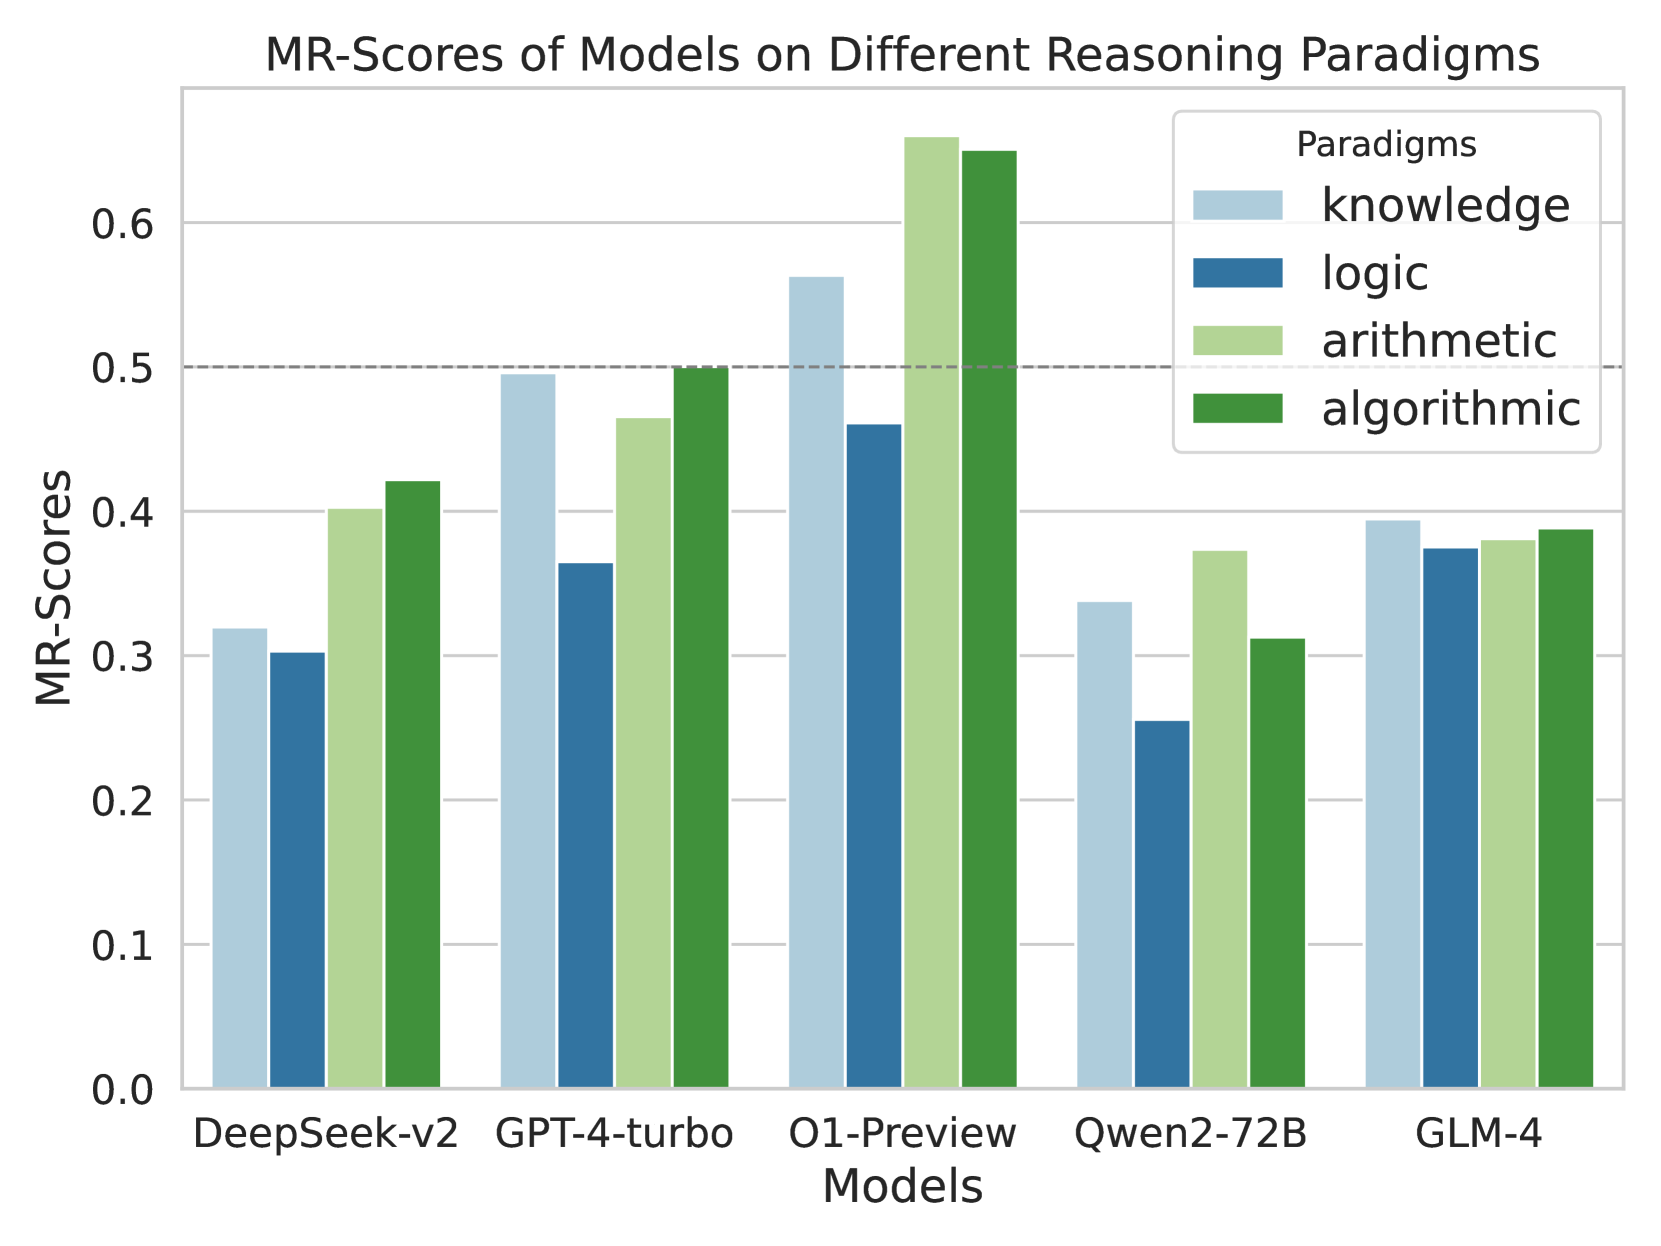
This image is a grouped bar chart comparing the performance of five different artificial intelligence models across four distinct reasoning paradigms. The performance is measured using a metric called "MR-Scores." The chart highlights comparative strengths and weaknesses of each model in specific cognitive tasks.
### Components/Axes
**Header Region (Top Center):**
* **Chart Title:** "MR-Scores of Models on Different Reasoning Paradigms"
**Legend Region (Top-Right, inside chart area):**
* **Title:** "Paradigms"
* **Categories & Color Mapping:**
* Light Blue square: `knowledge`
* Dark Blue square: `logic`
* Light Green square: `arithmetic`
* Dark Green square: `algorithmic`
**Y-Axis (Left side):**
* **Label:** "MR-Scores" (oriented vertically).
* **Scale:** Ranges from 0.0 to 0.6, with major tick marks and solid light-grey horizontal gridlines at intervals of 0.1 (0.0, 0.1, 0.2, 0.3, 0.4, 0.5, 0.6).
* **Special Marker:** There is a distinct, dark-grey dashed horizontal line spanning the width of the chart exactly at the 0.5 mark.
**X-Axis (Bottom):**
* **Label:** "Models" (centered below the categories).
* **Categories (Left to Right):** DeepSeek-v2, GPT-4-turbo, O1-Preview, Qwen2-72B, GLM-4.
### Detailed Analysis
*Trend Verification & Data Extraction by Model:*
**1. DeepSeek-v2 (Far Left)**
* *Visual Trend:* The bars show a dip from knowledge to logic, then a significant step up for arithmetic, and a slight increase for algorithmic. None of the bars reach the 0.5 dashed line.
* *Data Points:*
* knowledge (Light Blue): ~0.32
* logic (Dark Blue): ~0.30
* arithmetic (Light Green): ~0.40
* algorithmic (Dark Green): ~0.42
**2. GPT-4-turbo (Center Left)**
* *Visual Trend:* Knowledge is high, dropping sharply for logic, then stepping back up through arithmetic to peak at algorithmic. The algorithmic bar exactly touches the 0.5 dashed line.
* *Data Points:*
* knowledge (Light Blue): ~0.49
* logic (Dark Blue): ~0.36
* arithmetic (Light Green): ~0.46
* algorithmic (Dark Green): ~0.50
**3. O1-Preview (Center)**
* *Visual Trend:* This group contains the highest bars on the chart. Knowledge is high, logic dips, but arithmetic and algorithmic spike dramatically, breaking well past the 0.6 top gridline.
* *Data Points:*
* knowledge (Light Blue): ~0.56
* logic (Dark Blue): ~0.46
* arithmetic (Light Green): ~0.66
* algorithmic (Dark Green): ~0.65
**4. Qwen2-72B (Center Right)**
* *Visual Trend:* Overall lower performance. Knowledge drops to a chart-wide low for logic, spikes up for arithmetic, and drops again for algorithmic.
* *Data Points:*
* knowledge (Light Blue): ~0.34
* logic (Dark Blue): ~0.25
* arithmetic (Light Green): ~0.37
* algorithmic (Dark Green): ~0.31
**5. GLM-4 (Far Right)**
* *Visual Trend:* This is the most visually uniform group. All four bars are nearly identical in height, hovering just below the 0.4 line, showing a very flat distribution across paradigms.
* *Data Points:*
* knowledge (Light Blue): ~0.39
* logic (Dark Blue): ~0.37
* arithmetic (Light Green): ~0.38
* algorithmic (Dark Green): ~0.39
### Key Observations
* **Dominant Model:** O1-Preview significantly outperforms all other models across every single paradigm. It is the only model to consistently break the 0.5 dashed line (doing so in 3 out of 4 categories).
* **Weakest Paradigm:** Across almost all models (except GLM-4, where it is nearly tied), "logic" (Dark Blue) represents the lowest score, indicating it is the most challenging reasoning paradigm for these LLMs.
* **Most Balanced Model:** GLM-4 shows the least variance between paradigms, scoring between ~0.37 and ~0.39 across the board.
* **The 0.5 Threshold:** The explicit dashed line at 0.5 suggests a benchmark of significance. Only O1-Preview (knowledge, arithmetic, algorithmic) and GPT-4-turbo (algorithmic) meet or exceed this line.
### Interpretation
The data demonstrates a clear hierarchy in current model capabilities regarding complex reasoning. O1-Preview represents a generational leap, particularly in "arithmetic" and "algorithmic" tasks, suggesting its architecture is highly optimized for structured, mathematical, and step-by-step computational problem-solving.
Conversely, the universal dip in "logic" scores implies that abstract logical deduction remains a persistent bottleneck in AI development, even for the most advanced models like O1-Preview.
GLM-4's flat profile is highly unusual compared to the others; it suggests a model architecture or training methodology that prioritizes generalist consistency over specialized peaks, though it achieves this at the cost of not excelling in any single area.
The dashed line at 0.5 likely represents a critical threshold—perhaps a "pass" rate, a human baseline, or a previous state-of-the-art benchmark. The fact that O1-Preview shatters this line in math and algorithms indicates a paradigm shift in how models handle quantitative reasoning.