## Bar Chart: MR-Scores of Models on Different Reasoning Paradigms
### Overview
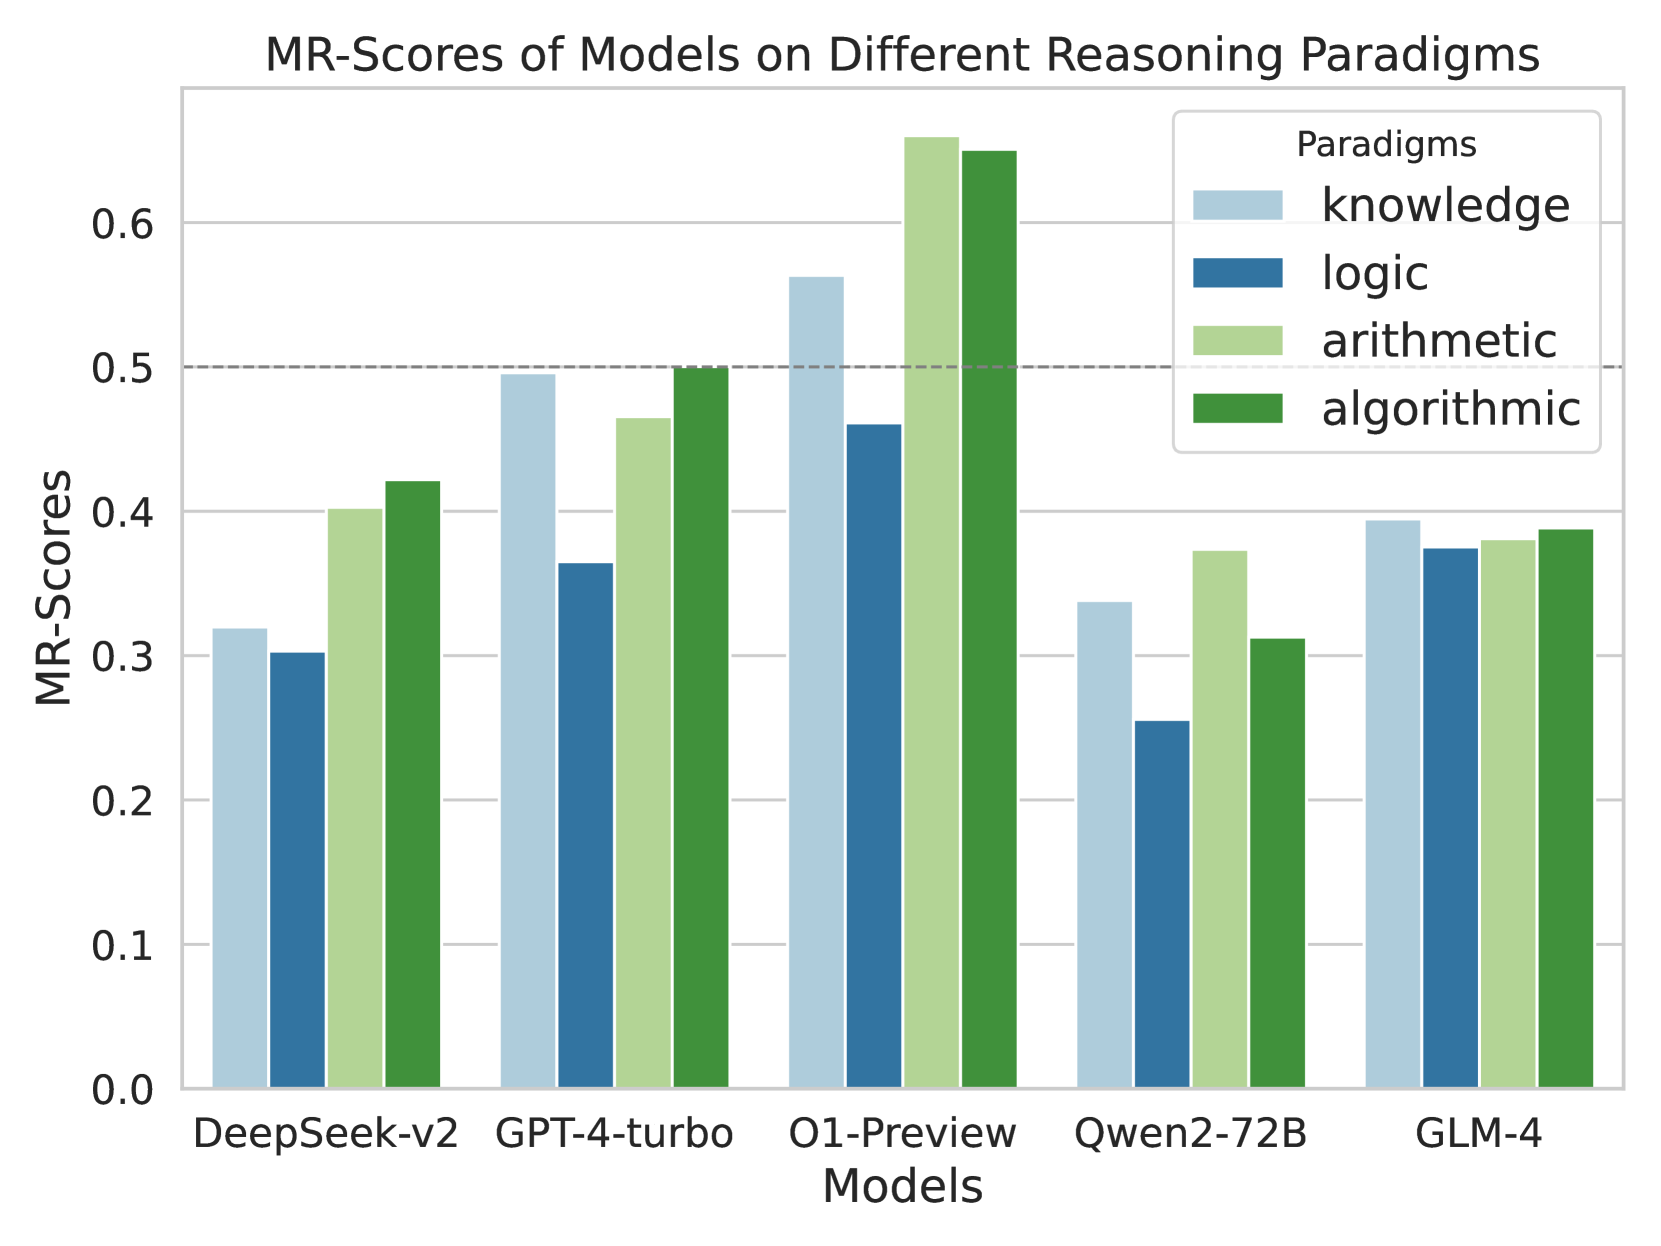
The image is a bar chart comparing the MR-Scores of different models (DeepSeek-v2, GPT-4-turbo, O1-Preview, Qwen2-72B, GLM-4) across four reasoning paradigms: knowledge, logic, arithmetic, and algorithmic. The chart displays the MR-Scores on the y-axis and the models on the x-axis. Each model has four bars representing its performance in each of the four paradigms.
### Components/Axes
* **Title:** MR-Scores of Models on Different Reasoning Paradigms
* **X-axis:**
* **Label:** Models
* **Categories:** DeepSeek-v2, GPT-4-turbo, O1-Preview, Qwen2-72B, GLM-4
* **Y-axis:**
* **Label:** MR-Scores
* **Scale:** 0.0 to 0.65, with increments of 0.1
* **Legend (top-right):**
* **Title:** Paradigms
* **Colors and Labels:**
* Light Blue: knowledge
* Dark Blue: logic
* Light Green: arithmetic
* Dark Green: algorithmic
* **Horizontal Gridlines:** Present at each 0.1 increment on the y-axis.
* **Horizontal Dashed Line:** Present at y=0.5
### Detailed Analysis
**DeepSeek-v2:**
* Knowledge (Light Blue): ~0.32
* Logic (Dark Blue): ~0.30
* Arithmetic (Light Green): ~0.40
* Algorithmic (Dark Green): ~0.42
**GPT-4-turbo:**
* Knowledge (Light Blue): ~0.49
* Logic (Dark Blue): ~0.36
* Arithmetic (Light Green): ~0.47
* Algorithmic (Dark Green): ~0.50
**O1-Preview:**
* Knowledge (Light Blue): ~0.56
* Logic (Dark Blue): ~0.46
* Arithmetic (Light Green): ~0.66
* Algorithmic (Dark Green): ~0.65
**Qwen2-72B:**
* Knowledge (Light Blue): ~0.34
* Logic (Dark Blue): ~0.26
* Arithmetic (Light Green): ~0.37
* Algorithmic (Dark Green): ~0.31
**GLM-4:**
* Knowledge (Light Blue): ~0.39
* Logic (Dark Blue): ~0.37
* Arithmetic (Light Green): ~0.38
* Algorithmic (Dark Green): ~0.39
### Key Observations
* O1-Preview has the highest MR-Scores overall, particularly in arithmetic and algorithmic reasoning.
* Qwen2-72B generally has the lowest MR-Scores across all paradigms.
* For most models, the algorithmic reasoning score is either the highest or close to the highest.
* The horizontal dashed line at MR-Score = 0.5 serves as a visual reference point.
### Interpretation
The bar chart provides a comparative analysis of the performance of different models on various reasoning paradigms. The data suggests that the O1-Preview model excels in both arithmetic and algorithmic reasoning compared to the other models. Qwen2-72B appears to be the weakest performer across all paradigms. The proximity of arithmetic and algorithmic scores for most models may indicate a correlation between these two types of reasoning tasks. The dashed line at 0.5 helps to quickly assess which models and paradigms achieve a relatively high MR-Score.