\n
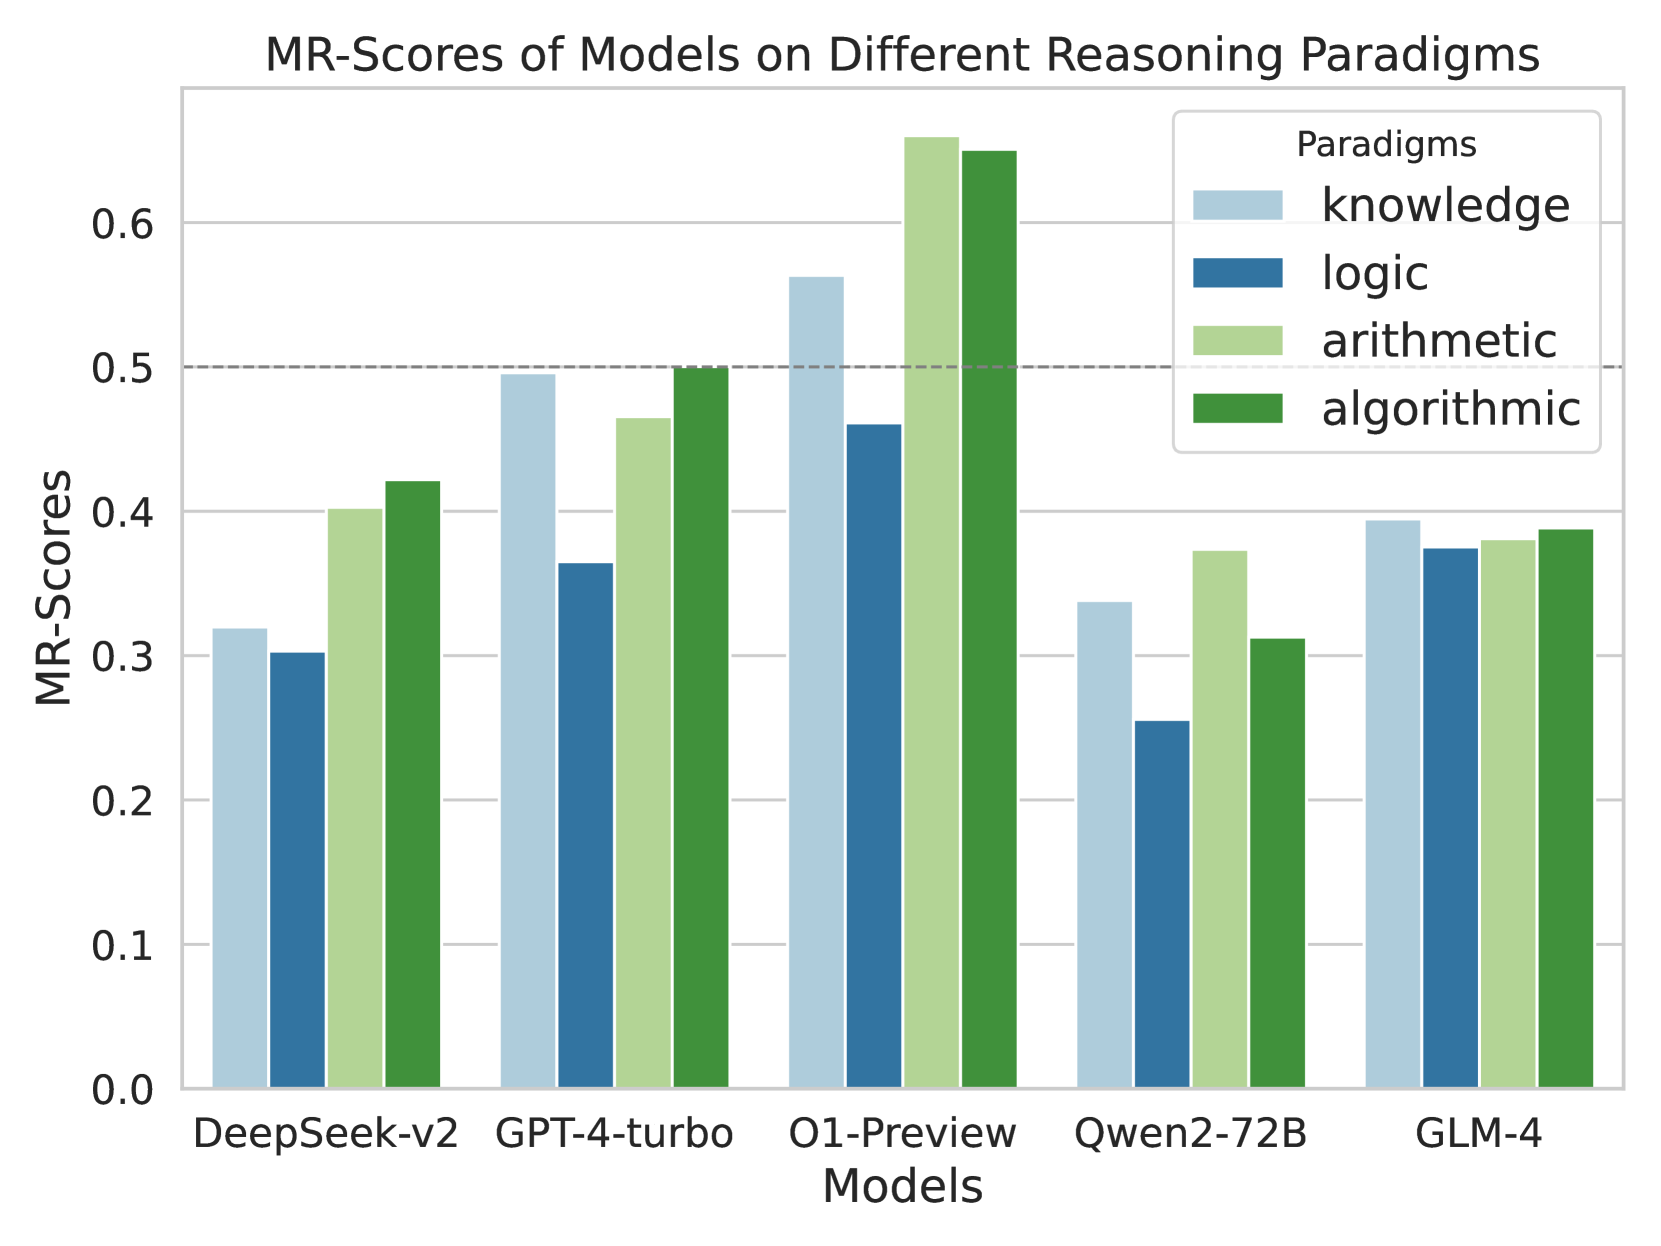
## Bar Chart: MR-Scores of Models on Different Reasoning Paradigms
### Overview
This bar chart compares the MR-Scores (likely a metric for reasoning ability) of five different models – DeepSeek-v2, GPT-4-turbo, O1-Preview, Qwen2-72B, and GLM-4 – across four reasoning paradigms: knowledge, logic, arithmetic, and algorithmic. Each model has four bars representing its score on each paradigm.
### Components/Axes
* **X-axis:** Models - DeepSeek-v2, GPT-4-turbo, O1-Preview, Qwen2-72B, GLM-4.
* **Y-axis:** MR-Scores, ranging from 0.0 to 0.6, with increments of 0.1.
* **Legend:** Located in the top-right corner, defining the color-coding for each reasoning paradigm:
* knowledge (light blue)
* logic (blue)
* arithmetic (light green)
* algorithmic (dark green)
### Detailed Analysis
The chart consists of 20 bars (5 models x 4 paradigms). I will analyze each model's performance across the paradigms.
**DeepSeek-v2:**
* Knowledge: Approximately 0.32
* Logic: Approximately 0.31
* Arithmetic: Approximately 0.42
* Algorithmic: Approximately 0.41
**GPT-4-turbo:**
* Knowledge: Approximately 0.47
* Logic: Approximately 0.48
* Arithmetic: Approximately 0.51
* Algorithmic: Approximately 0.52
**O1-Preview:**
* Knowledge: Approximately 0.56
* Logic: Approximately 0.48
* Arithmetic: Approximately 0.58
* Algorithmic: Approximately 0.51
**Qwen2-72B:**
* Knowledge: Approximately 0.34
* Logic: Approximately 0.27
* Arithmetic: Approximately 0.34
* Algorithmic: Approximately 0.36
**GLM-4:**
* Knowledge: Approximately 0.38
* Logic: Approximately 0.37
* Arithmetic: Approximately 0.41
* Algorithmic: Approximately 0.39
**Trends:**
* For most models, the algorithmic and arithmetic scores are generally higher than knowledge and logic scores.
* O1-Preview consistently demonstrates the highest scores across all paradigms.
* Qwen2-72B consistently demonstrates the lowest scores across all paradigms.
* GPT-4-turbo shows a relatively balanced performance across all paradigms.
### Key Observations
* O1-Preview significantly outperforms other models in all reasoning paradigms.
* Qwen2-72B consistently underperforms compared to other models.
* There's a noticeable gap in performance between the top-performing (O1-Preview) and bottom-performing (Qwen2-72B) models.
* The difference in scores between paradigms within a single model is often smaller than the difference in scores between models for the same paradigm.
### Interpretation
The data suggests that O1-Preview is the most capable model across a range of reasoning tasks, while Qwen2-72B lags behind. The consistent trend of higher scores in arithmetic and algorithmic reasoning compared to knowledge and logic might indicate that these models are better at tasks requiring computation and pattern recognition than those requiring broad knowledge recall or abstract reasoning. The relatively small differences in scores *within* a model suggest that the models have a more consistent reasoning ability across different types of tasks, rather than excelling in one area while failing in others. The large gap between O1-Preview and Qwen2-72B could be due to differences in model size, training data, or architectural choices. Further investigation would be needed to determine the specific factors contributing to these performance differences. The MR-Score metric appears to be sensitive enough to differentiate between these models, providing a useful benchmark for evaluating reasoning capabilities.