## Bar Chart: Average Attention Intensity per Input Prompt Token
### Overview
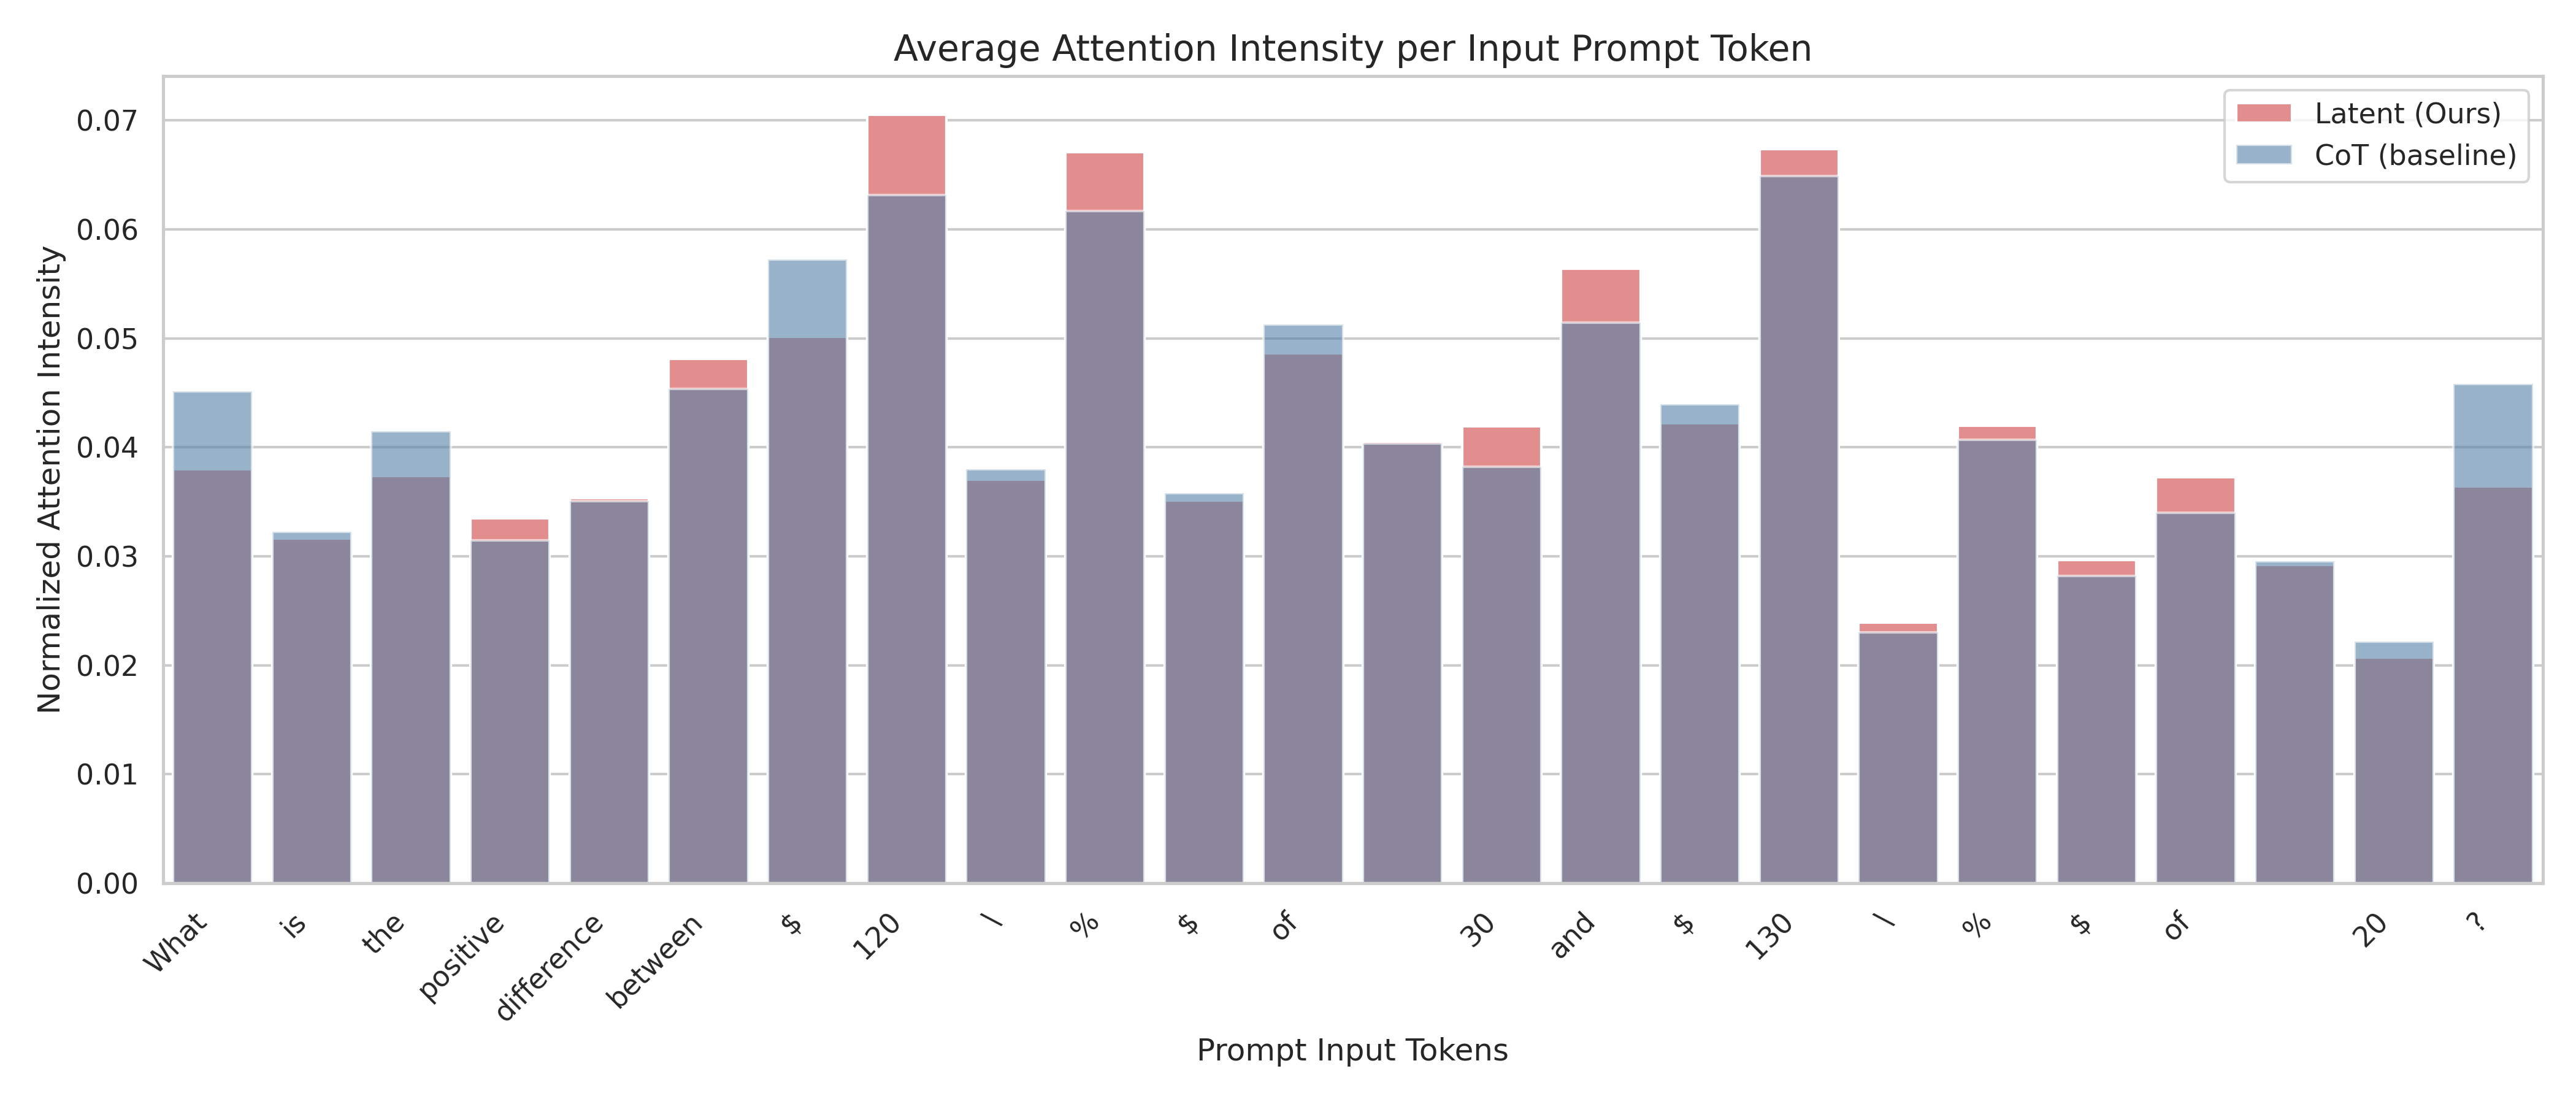
The image is a bar chart comparing the average attention intensity per input prompt token for two models: "Latent (Ours)" and "CoT (baseline)". The x-axis represents the prompt input tokens, and the y-axis represents the normalized attention intensity. The chart displays the attention intensity of each model for each token in the prompt.
### Components/Axes
* **Title:** Average Attention Intensity per Input Prompt Token
* **X-axis:** Prompt Input Tokens
* Tokens: What, is, the, positive, difference, between, $, 120, /, %, $, of, 30, and, $, 130, /, %, $, of, 20, ?
* **Y-axis:** Normalized Attention Intensity
* Scale: 0.00 to 0.07, with increments of 0.01
* **Legend:** Located in the top-right corner.
* Latent (Ours): Represented by light red bars.
* CoT (baseline): Represented by light blue bars.
### Detailed Analysis
The chart presents a comparison of attention intensities for each token between the "Latent (Ours)" model and the "CoT (baseline)" model. The base of each bar represents the CoT (baseline) attention intensity, and the red portion stacked on top represents the additional attention intensity from the Latent (Ours) model.
Here's a breakdown of the approximate attention intensities for each token:
* **What:** CoT (baseline) ~0.04, Latent (Ours) ~0.005
* **is:** CoT (baseline) ~0.032, Latent (Ours) ~0
* **the:** CoT (baseline) ~0.037, Latent (Ours) ~0.004
* **positive:** CoT (baseline) ~0.031, Latent (Ours) ~0.003
* **difference:** CoT (baseline) ~0.034, Latent (Ours) ~0.001
* **between:** CoT (baseline) ~0.045, Latent (Ours) ~0.003
* **$:** CoT (baseline) ~0.057, Latent (Ours) ~0
* **120:** CoT (baseline) ~0.063, Latent (Ours) ~0.007
* **/:** CoT (baseline) ~0.037, Latent (Ours) ~0.001
* **%:** CoT (baseline) ~0.062, Latent (Ours) ~0.005
* **$:** CoT (baseline) ~0.035, Latent (Ours) ~0.001
* **of:** CoT (baseline) ~0.049, Latent (Ours) ~0.002
* **30:** CoT (baseline) ~0.04, Latent (Ours) ~0
* **and:** CoT (baseline) ~0.038, Latent (Ours) ~0.004
* **$:** CoT (baseline) ~0.051, Latent (Ours) ~0.005
* **130:** CoT (baseline) ~0.042, Latent (Ours) ~0.002
* **/:** CoT (baseline) ~0.065, Latent (Ours) ~0.002
* **%:** CoT (baseline) ~0.023, Latent (Ours) ~0
* **$:** CoT (baseline) ~0.041, Latent (Ours) ~0.001
* **of:** CoT (baseline) ~0.029, Latent (Ours) ~0.004
* **20:** CoT (baseline) ~0.029, Latent (Ours) ~0
* **?:** CoT (baseline) ~0.022, Latent (Ours) ~0
* **?:** CoT (baseline) ~0.036, Latent (Ours) ~0.01
### Key Observations
* The CoT (baseline) model generally has a higher attention intensity than the Latent (Ours) model for most tokens.
* The Latent (Ours) model shows increased attention intensity for specific tokens like "120", "%", "and", and "of".
* The attention intensity varies significantly across different tokens, indicating that the models focus on different parts of the input prompt.
### Interpretation
The bar chart provides insights into how the "Latent (Ours)" model and the "CoT (baseline)" model attend to different tokens within the input prompt. The "Latent (Ours)" model seems to focus more on numerical and symbolic tokens ("120", "%", "$"), while the "CoT (baseline)" model distributes its attention more evenly across the prompt. This suggests that the "Latent (Ours)" model might be prioritizing specific numerical or symbolic information within the prompt, potentially for more precise calculations or reasoning. The differences in attention intensity highlight the distinct processing strategies employed by each model.