\n
## Bar Chart: Average Attention Intensity per Input Prompt Token
### Overview
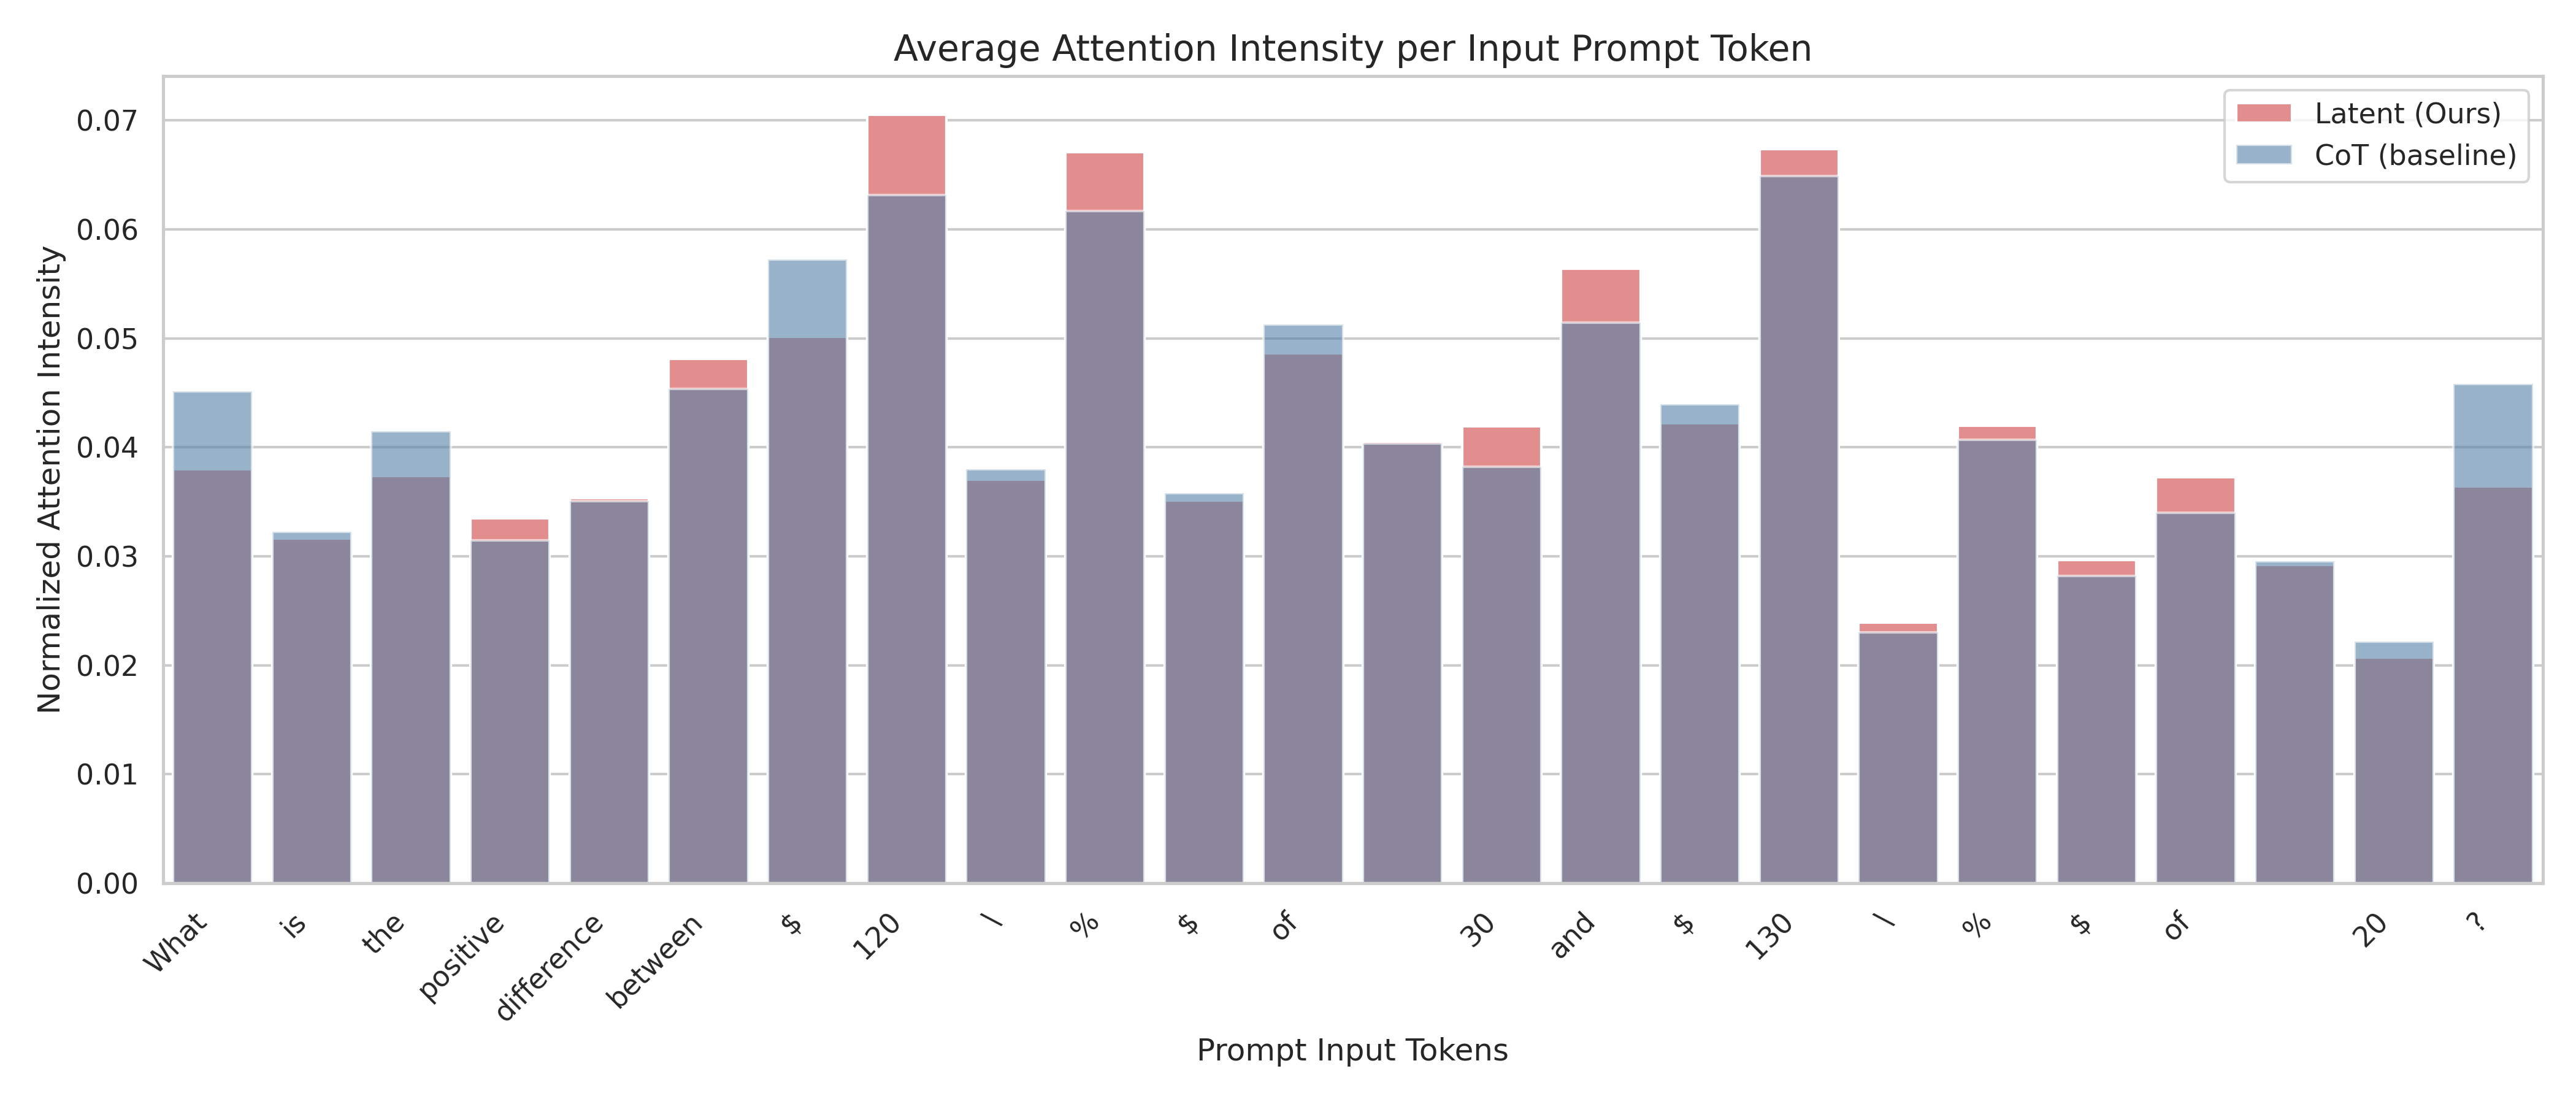
This is a stacked bar chart visualizing the average attention intensity for each input prompt token. The chart compares two models: "Latent (Ours)" and "CoT (baseline)". The x-axis represents the prompt input tokens, and the y-axis represents the normalized attention intensity. Each bar is divided into two sections, representing the attention intensity contributed by each model.
### Components/Axes
* **Title:** Average Attention Intensity per Input Prompt Token
* **X-axis:** Prompt Input Tokens. The tokens are: "What", "is", "the", "positive", "difference", "between", "≤", "120", "\\", "%", "$", "of", "30", "and", "$", "130", "\\", "%", "of", "20", "?".
* **Y-axis:** Normalized Attention Intensity (ranging from 0.00 to 0.07).
* **Legend:**
* "Latent (Ours)" - represented by a reddish-pink color.
* "CoT (baseline)" - represented by a blue color.
### Detailed Analysis
The chart consists of 21 stacked bars, one for each prompt token. The height of each bar represents the total attention intensity for that token, and the sections within each bar show the contribution of each model.
Here's a breakdown of the attention intensity for each token, with approximate values:
* **What:** Latent: ~0.015, CoT: ~0.025. Total: ~0.04
* **is:** Latent: ~0.015, CoT: ~0.025. Total: ~0.04
* **the:** Latent: ~0.02, CoT: ~0.02. Total: ~0.04
* **positive:** Latent: ~0.03, CoT: ~0.01. Total: ~0.04
* **difference:** Latent: ~0.02, CoT: ~0.025. Total: ~0.045
* **between:** Latent: ~0.045, CoT: ~0.01. Total: ~0.055
* **≤:** Latent: ~0.06, CoT: ~0.01. Total: ~0.07
* **120:** Latent: ~0.04, CoT: ~0.03. Total: ~0.07
* **\\:** Latent: ~0.01, CoT: ~0.02. Total: ~0.03
* **%:** Latent: ~0.01, CoT: ~0.02. Total: ~0.03
* **$:** Latent: ~0.01, CoT: ~0.03. Total: ~0.04
* **of:** Latent: ~0.03, CoT: ~0.015. Total: ~0.045
* **30:** Latent: ~0.04, CoT: ~0.005. Total: ~0.045
* **and:** Latent: ~0.02, CoT: ~0.02. Total: ~0.04
* **$:** Latent: ~0.01, CoT: ~0.02. Total: ~0.03
* **130:** Latent: ~0.02, CoT: ~0.01. Total: ~0.03
* **\\:** Latent: ~0.01, CoT: ~0.01. Total: ~0.02
* **%:** Latent: ~0.01, CoT: ~0.01. Total: ~0.02
* **of:** Latent: ~0.03, CoT: ~0.01. Total: ~0.04
* **20:** Latent: ~0.025, CoT: ~0.015. Total: ~0.04
* **?:** Latent: ~0.03, CoT: ~0.02. Total: ~0.05
**Trends:**
* The "CoT (baseline)" model consistently contributes a significant portion of the attention intensity across all tokens.
* The "Latent (Ours)" model shows higher attention intensity for tokens like "≤", "120", "30", and "?".
* The total attention intensity varies significantly across tokens, with "≤" and "120" receiving the highest attention.
### Key Observations
* The highest total attention intensity is observed for the token "≤", reaching approximately 0.07.
* The "Latent (Ours)" model appears to be more sensitive to specific tokens, particularly those related to numerical values and symbols.
* The "CoT (baseline)" model provides a relatively stable baseline attention intensity across all tokens.
### Interpretation
The chart demonstrates how attention is distributed across different tokens in a prompt when using two different models. The "CoT (baseline)" model seems to provide a consistent level of attention to all tokens, while the "Latent (Ours)" model focuses more intensely on specific tokens, particularly those involving mathematical symbols and numbers. This suggests that the "Latent (Ours)" model may be better at processing and understanding numerical information within the prompt. The high attention intensity for "≤" and "120" could indicate that these tokens are crucial for the task the model is performing. The difference in attention patterns between the two models highlights the impact of different architectures and training strategies on attention mechanisms. The stacked bar chart effectively visualizes the contribution of each model to the overall attention intensity, allowing for a clear comparison of their strengths and weaknesses.