## Bar Chart: Average Attention Intensity per Input Prompt Token
### Overview
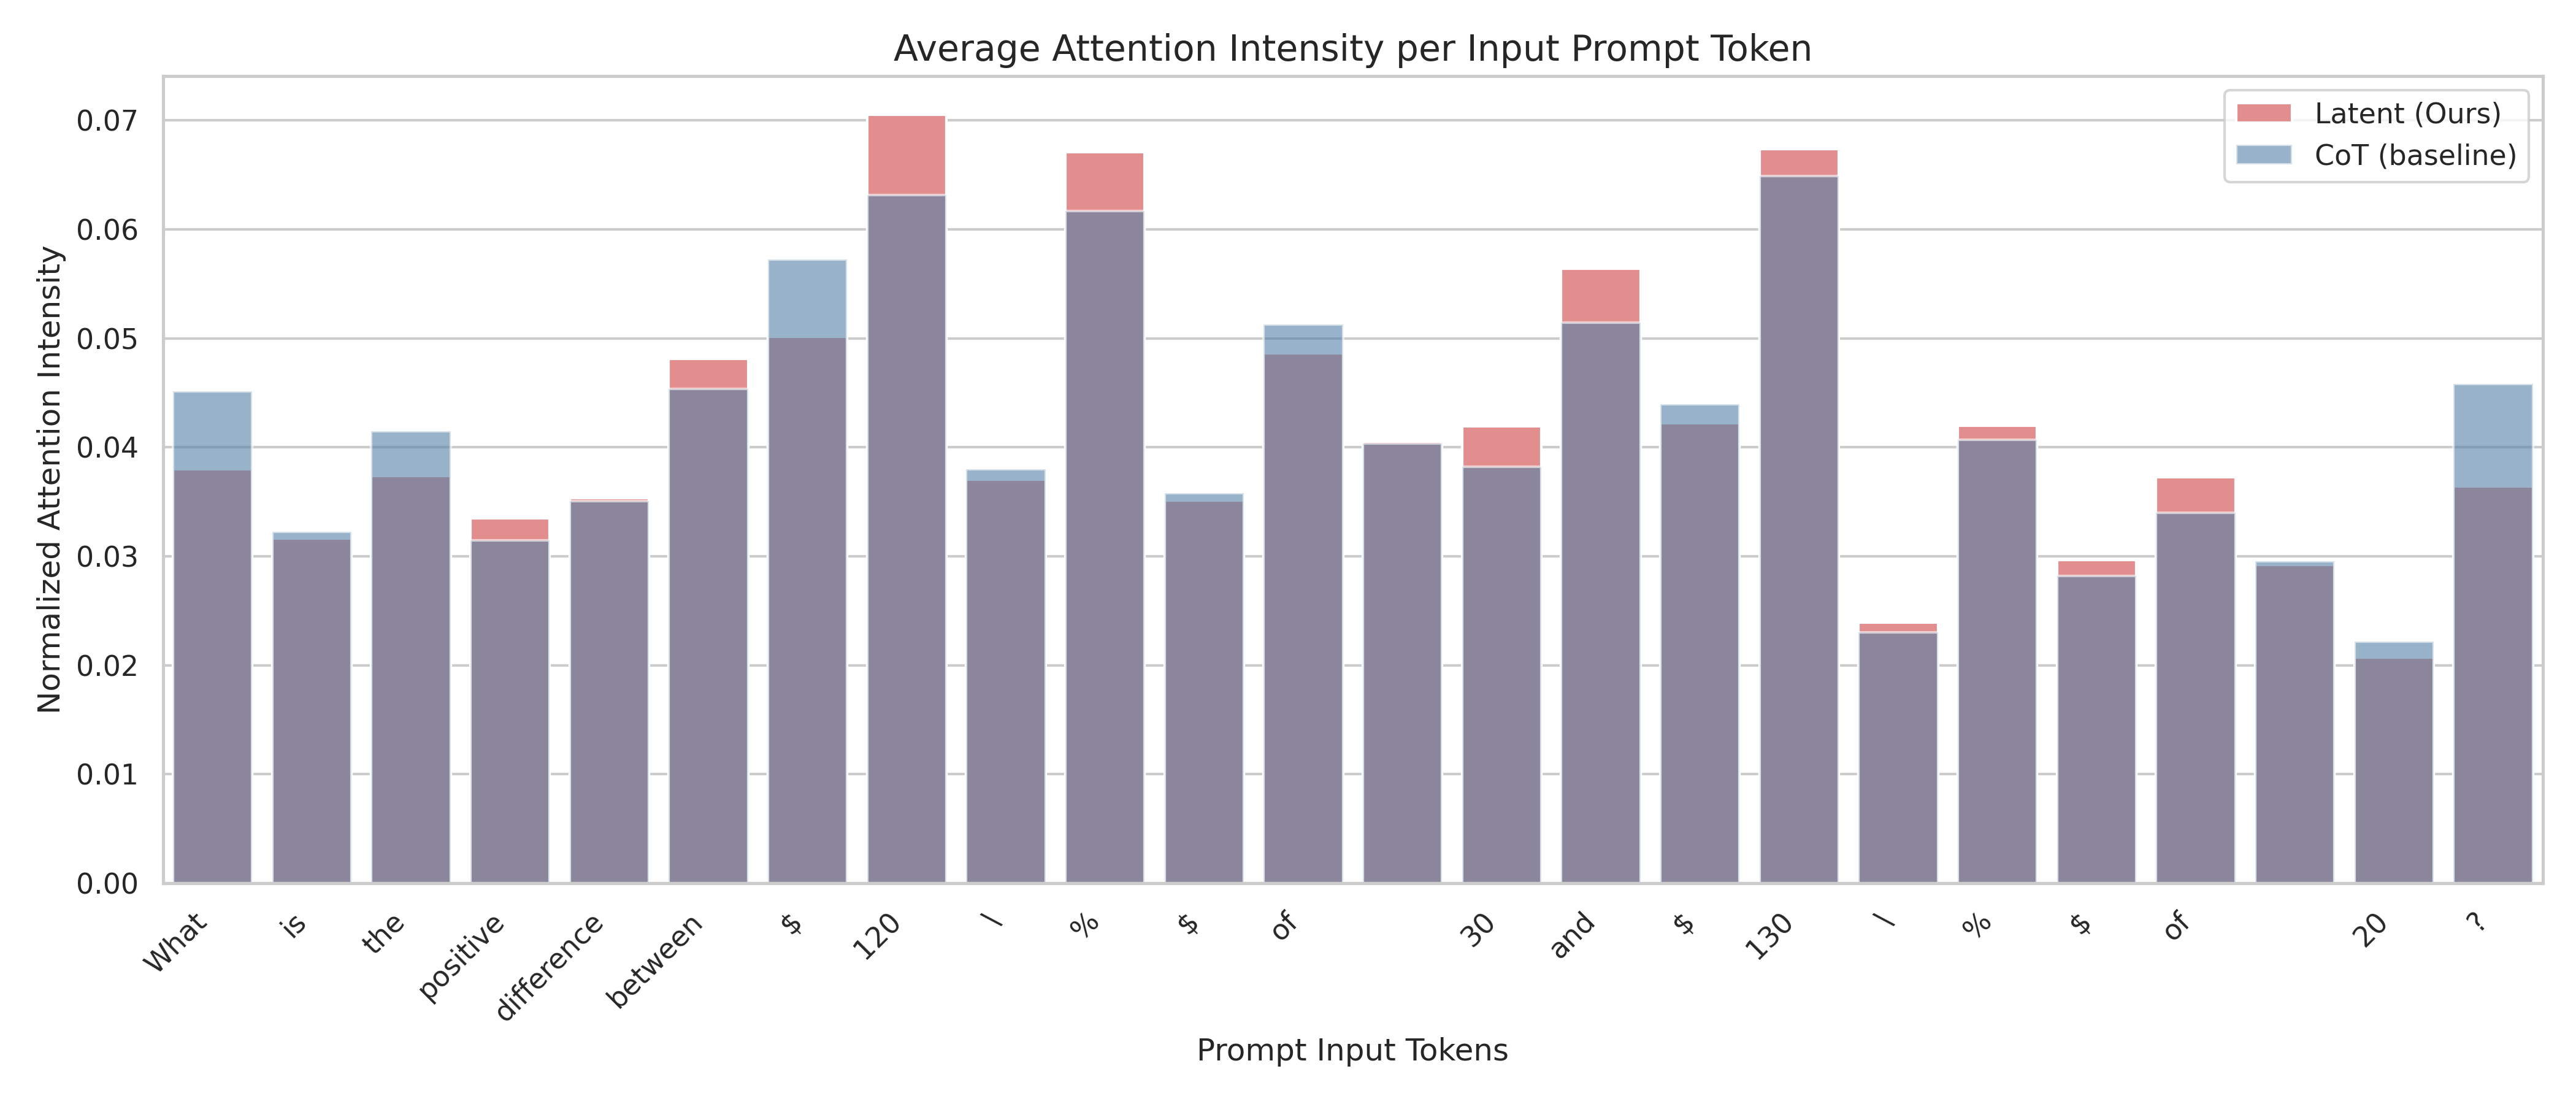
This is a stacked bar chart comparing the "Normalized Attention Intensity" assigned to each token in a specific input prompt by two different methods: "Latent (Ours)" and "CoT (baseline)". The chart visualizes how attention is distributed across the words and symbols of the prompt.
### Components/Axes
* **Chart Title:** "Average Attention Intensity per Input Prompt Token"
* **Y-Axis:**
* **Label:** "Normalized Attention Intensity"
* **Scale:** Linear, ranging from 0.00 to 0.07, with major gridlines at intervals of 0.01.
* **X-Axis:**
* **Label:** "Prompt Input Tokens"
* **Categories (Tokens):** The tokens, in order, are: `What`, `is`, `the`, `positive`, `difference`, `between`, `$`, `120`, `/`, `%`, `$`, `of`, `30`, `and`, `$`, `130`, `/`, `%`, `$`, `of`, `20`, `?`. These tokens form the question: "What is the positive difference between $ 120 / % $ of 30 and $ 130 / % $ of 20 ?"
* **Legend:**
* **Location:** Top-right corner of the chart area.
* **Series 1:** "Latent (Ours)" - Represented by a light red/salmon color.
* **Series 2:** "CoT (baseline)" - Represented by a light blue/steel blue color.
* **Bar Structure:** Each bar is stacked. The blue "CoT (baseline)" segment forms the base, and the red "Latent (Ours)" segment is placed on top. The total height of the bar represents the combined normalized attention intensity for that token from both methods.
### Detailed Analysis
The following table reconstructs the approximate data points for each token. Values are estimated from the chart's gridlines. The "Total" is the sum of the two series.
| Prompt Token | CoT (baseline) [Blue, Base] | Latent (Ours) [Red, Top] | Total Height (Approx.) |
| :--- | :--- | :--- | :--- |
| What | ~0.038 | ~0.007 | ~0.045 |
| is | ~0.032 | ~0.000 | ~0.032 |
| the | ~0.037 | ~0.004 | ~0.041 |
| positive | ~0.031 | ~0.002 | ~0.033 |
| difference | ~0.035 | ~0.000 | ~0.035 |
| between | ~0.045 | ~0.003 | ~0.048 |
| $ | ~0.050 | ~0.007 | ~0.057 |
| **120** | **~0.063** | **~0.007** | **~0.070** |
| / | ~0.037 | ~0.001 | ~0.038 |
| % | ~0.062 | ~0.005 | ~0.067 |
| $ | ~0.035 | ~0.001 | ~0.036 |
| of | ~0.049 | ~0.002 | ~0.051 |
| 30 | ~0.040 | ~0.000 | ~0.040 |
| and | ~0.038 | ~0.004 | ~0.042 |
| $ | ~0.051 | ~0.005 | ~0.056 |
| **130** | **~0.065** | **~0.002** | **~0.067** |
| / | ~0.042 | ~0.002 | ~0.044 |
| % | ~0.023 | ~0.001 | ~0.024 |
| $ | ~0.041 | ~0.001 | ~0.042 |
| of | ~0.028 | ~0.002 | ~0.030 |
| 20 | ~0.034 | ~0.003 | ~0.037 |
| ? | ~0.021 | ~0.001 | ~0.022 |
**Trend Verification:**
* The attention intensity is not uniform across tokens.
* Numerical tokens (`120`, `130`, `30`, `20`) and certain symbols (`$`, `%`) generally receive higher attention than common words (`is`, `the`, `and`).
* The token `120` has the highest total attention intensity (~0.070), closely followed by `130` (~0.067) and `%` (~0.067).
* The lowest attention is given to the final question mark `?` (~0.022).
### Key Observations
1. **Peak Attention on Numerical Values:** The tokens `120` and `130` are the clear peaks in the chart, indicating these specific numbers are the primary focus of the model's attention in this prompt.
2. **High Attention on Financial/Percentage Symbols:** The `$` and `%` symbols consistently show elevated attention levels, especially the first `$` and the first `%`.
3. **Variable Contribution of "Latent (Ours)":** The red "Latent" segment adds a noticeable amount of attention on top of the blue "CoT" baseline for several tokens (e.g., `What`, `$`, `120`, `%`, `and`, `$`). However, for many other tokens (e.g., `is`, `difference`, `30`), its contribution is minimal or zero.
4. **Baseline Dominance:** The "CoT (baseline)" method accounts for the vast majority of the attention intensity for every single token. The "Latent" method provides only a small incremental addition.
### Interpretation
This chart demonstrates how two different processing methods ("CoT" and "Latent") allocate attention to the components of a mathematical word problem. The data suggests:
* **The model's "focus" is on the operands and operators.** The highest attention is on the numbers (`120`, `130`) and the percentage/financial symbols (`%`, `$`), which are the core quantitative elements of the question. Function words (`is`, `the`, `of`) receive significantly less attention.
* **The "Latent" method appears to be a refinement technique.** It does not redistribute attention broadly but instead seems to selectively boost the attention on tokens that are already important according to the baseline CoT method (like the numbers and key symbols). This could imply it's designed to sharpen focus on critical information rather than discover new important tokens.
* **The prompt structure is mirrored in the attention pattern.** The two main clauses of the question ("...$ 120 / % $ of 30" and "...$ 130 / % $ of 20") create a parallel structure in the attention peaks, with `120` and `130` being the twin focal points. This indicates the model successfully parses the comparative structure of the query.
In essence, the visualization confirms that the model's attention mechanism, under both methods, correctly identifies the numerical values and financial symbols as the most salient parts of this specific arithmetic prompt. The "Latent" method's role is to marginally intensify this pre-existing focus.