# Technical Document Extraction: Conductance Oscillations in Quantum Systems
## Main Plot (Panel c)
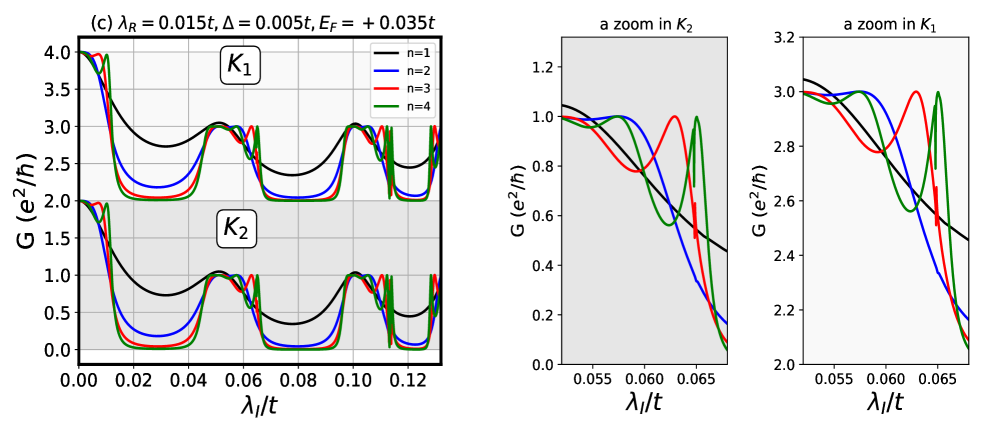
### Axes and Labels
- **X-axis**: $\lambda_I/t$ (dimensionless interaction strength)
- **Y-axis**: $G (e^2/h)$ (conductance normalized by quantum of conductance)
- **Subplots**:
- Top: $K_1$ (upper conductance regime)
- Bottom: $K_2$ (lower conductance regime)
### Legend
- **$n=1$**: Black curve (lowest conductance)
- **$n=2$**: Blue curve
- **$n=3$**: Red curve
- **$n=4$**: Green curve (highest conductance)
### Parameters
- $\lambda_R = 0.015t$
- $\Delta = 0.005t$
- $E_F = +0.035t$
### Key Trends
1. **Oscillatory Behavior**: All $n$ curves exhibit periodic oscillations in $G$ as $\lambda_I/t$ increases.
2. **Amplitude Modulation**:
- $n=1$ (black) shows the most pronounced oscillations.
- Higher $n$ values (blue, red, green) exhibit damped oscillations with reduced amplitude.
3. **Resonance Peaks**:
- Peaks in $G$ occur at regular intervals of $\lambda_I/t$.
- $K_1$ (top) displays sharper peaks compared to $K_2$ (bottom).
## Inset: Zoom in $K_2$ (Panel a)
### Axes and Labels
- **X-axis**: $\lambda_I/t$ (range: 0.055–0.065)
- **Y-axis**: $G (e^2/h)$ (range: 0–1.2)
- **Focus**: Highlights fine structure of oscillations near resonance.
### Key Observations
- **Damping Effect**: Higher $n$ curves (blue, red, green) show rapid decay in $G$ compared to $n=1$ (black).
- **Phase Shifts**:
- $n=2$ (blue) and $n=3$ (red) exhibit phase differences relative to $n=1$.
- $n=4$ (green) shows a distinct secondary peak near $\lambda_I/t \approx 0.06$.
## Inset: Zoom in $K_1$ (Panel b)
### Axes and Labels
- **X-axis**: $\lambda_I/t$ (range: 0.055–0.065)
- **Y-axis**: $G (e^2/h)$ (range: 2.0–3.2)
- **Focus**: Details oscillations in the higher conductance regime.
### Key Observations
- **Peak Sharpness**: $n=1$ (black) maintains the sharpest resonance peak.
- **Interference Patterns**:
- $n=2$ (blue) and $n=3$ (red) display destructive interference near $\lambda_I/t \approx 0.06$.
- $n=4$ (green) exhibits a secondary peak at $\lambda_I/t \approx 0.062$.
## Cross-Referenced Legend Consistency
- **Color-Line Matching**:
- All panels confirm $n=1$ (black), $n=2$ (blue), $n=3$ (red), $n=4$ (green).
- No discrepancies observed between legend labels and curve colors.
## Summary
The plots demonstrate quantized conductance oscillations in a system with parameters $\lambda_R = 0.015t$, $\Delta = 0.005t$, and $E_F = +0.035t$. The oscillations exhibit $n$-dependent damping and phase shifts, with sharper features in $K_1$ compared to $K_2$. Zoomed insets reveal fine interference patterns critical for understanding many-body effects.