## Heatmap: Spatiotemporal Compression Heatmaps (Q-Projection)
### Overview
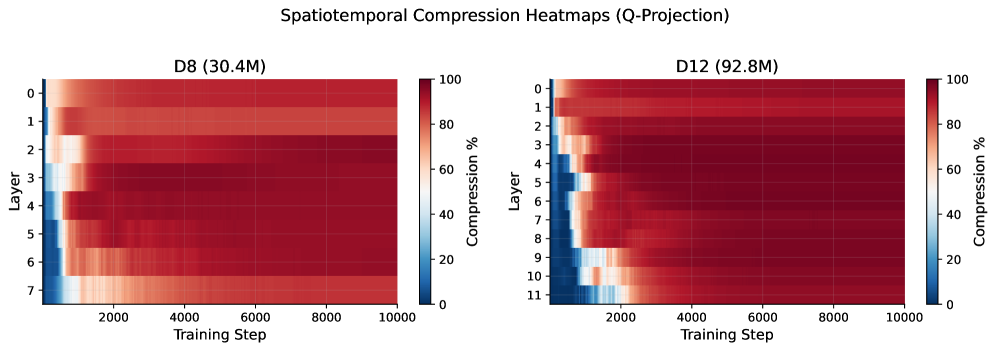
The image presents two side-by-side heatmaps comparing spatiotemporal compression efficiency across layers of two neural network architectures (D8 and D12) during training. Compression percentages are visualized using a red-to-blue gradient, where red indicates higher compression (closer to 100%) and blue indicates lower compression (closer to 0%). The x-axis represents training steps (2000–10,000), and the y-axis represents layers (0–7 for D8, 0–11 for D12).
---
### Components/Axes
- **Title**: "Spatiotemporal Compression Heatmaps (Q-Projection)"
- **Legend**: Color bar on the right labeled "Compression %" (0% = blue, 100% = red).
- **Axes**:
- **Left Panel (D8)**:
- Y-axis: Layers 0–7 (8 layers total).
- X-axis: Training steps 2000–10,000.
- **Right Panel (D12)**:
- Y-axis: Layers 0–11 (12 layers total).
- X-axis: Training steps 2000–10,000.
---
### Detailed Analysis
#### D8 (30.4M Parameters)
- **Layer 0–2**:
- Compression starts at ~40–60% (light red) at 2000 steps, peaks at ~80–100% (dark red) around 4000–6000 steps, then stabilizes.
- Layer 0 shows the highest compression (~90–100% by 10,000 steps).
- **Layer 3–4**:
- Compression begins at ~50–70% (mid-red) at 2000 steps, peaks at ~80–90% (dark red) around 6000 steps, then plateaus.
- **Layer 5–7**:
- Compression starts at ~30–50% (light red) at 2000 steps, peaks at ~60–80% (mid-red) around 8000 steps, with significant variability (e.g., Layer 7 shows a blue patch at 2000 steps, indicating ~10–20% compression).
#### D12 (92.8M Parameters)
- **Layer 0–3**:
- Compression starts at ~50–70% (mid-red) at 2000 steps, peaks at ~85–100% (dark red) around 4000–6000 steps, then stabilizes.
- Layer 0 shows the highest compression (~95–100% by 10,000 steps).
- **Layer 4–7**:
- Compression begins at ~40–60% (light red) at 2000 steps, peaks at ~70–90% (dark red) around 6000 steps, then declines slightly.
- **Layer 8–11**:
- Compression starts at ~20–40% (light red/blue) at 2000 steps, peaks at ~50–70% (mid-red) around 8000 steps, with lower overall efficiency compared to upper layers.
---
### Key Observations
1. **Layer-Specific Trends**:
- Upper layers (0–3 in D8, 0–3 in D12) achieve the highest compression, suggesting they are more amenable to compression.
- Lower layers (5–7 in D8, 8–11 in D12) exhibit lower compression, particularly in early training steps.
2. **Model Size Impact**:
- D12 (larger model) shows more layers with moderate-to-high compression but retains lower compression in deeper layers compared to D8.
3. **Training Progression**:
- Compression improves significantly in the first 6,000 steps for most layers, with diminishing returns afterward.
4. **Anomalies**:
- Layer 7 in D8 and Layer 11 in D12 show abrupt drops in compression at 2000 steps (blue regions), indicating potential instability or inefficiency in early training.
---
### Interpretation
The heatmaps reveal that **upper layers of both models compress more effectively**, likely due to their role in higher-level feature extraction, which becomes stable earlier in training. **Larger models (D12)** have more layers but exhibit a broader range of compression efficiency, with deeper layers lagging behind. This suggests that while deeper architectures may offer greater capacity, they require more training to achieve comparable compression in lower layers. The anomalies in early training (e.g., blue patches) highlight potential challenges in compressing less critical or dynamically evolving layers. These insights could inform strategies for optimizing model size without sacrificing performance.