## Graph Evolution Diagram: Network State at Different Time Steps
### Overview
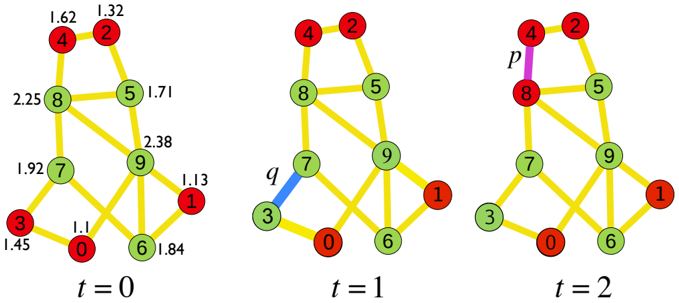
The image shows a network diagram evolving through three time steps (t=0, t=1, t=2). The network consists of nodes (numbered 0-9) and edges (represented by lines). The nodes are colored either red or green. The edges are generally yellow, but some edges are highlighted in blue or magenta to indicate changes between time steps. Numerical values are associated with some edges in the first time step.
### Components/Axes
* **Nodes:** Numbered 0 through 9, represented by circles. Node colors are either red or green.
* **Edges:** Represented by yellow lines connecting the nodes. Some edges are highlighted in blue or magenta.
* **Time Steps:** Three distinct network states labeled as t=0, t=1, and t=2.
* **Edge Weights (t=0):** Numerical values associated with some edges in the first time step.
* **Highlighted Edges:** A blue edge labeled 'q' in t=1 and a magenta edge labeled 'p' in t=2.
### Detailed Analysis
**Time Step t=0:**
* Nodes 0, 1, 2, 3, and 4 are red.
* Nodes 5, 6, 7, 8, and 9 are green.
* Edge weights are present for some edges:
* Edge between nodes 4 and 8: 1.62
* Edge between nodes 4 and 2: 1.32
* Edge between nodes 8 and 5: 2.25
* Edge between nodes 5 and 9: 1.71
* Edge between nodes 7 and 8: 1.92
* Edge between nodes 9 and 1: 2.38
* Edge between nodes 3 and 0: 1.45
* Edge between nodes 0 and 6: 1.1
* Edge between nodes 6 and 9: 1.84
* Edge between nodes 1 and 6: 1.13
**Time Step t=1:**
* Nodes 0, 1, 2, and 4 are red.
* Nodes 3, 5, 6, 7, 8, and 9 are green.
* A blue edge labeled 'q' connects nodes 3 and 7.
**Time Step t=2:**
* Nodes 0, 1, 2, 4, and 8 are red.
* Nodes 3, 5, 6, 7, and 9 are green.
* A magenta edge labeled 'p' connects nodes 4 and 8.
### Key Observations
* The network structure remains generally consistent across the three time steps, but the node colors change.
* At t=1, node 3 changes from red to green.
* At t=2, node 8 changes from green to red.
* The highlighted edges (blue 'q' and magenta 'p') indicate specific changes or events occurring in the network.
* The edge weights are only present at t=0.
### Interpretation
The diagram illustrates the evolution of a network where nodes can change their state (represented by color). The highlighted edges 'q' and 'p' likely represent specific interactions or events that trigger the state changes in nodes 3 and 8, respectively. The edge weights at t=0 could represent the initial strength or importance of connections within the network. The change in node colors suggests a dynamic process occurring within the network, possibly representing the spread of information, influence, or some other property. The absence of edge weights at t=1 and t=2 suggests that these values are either not relevant or are changing over time.