\n
## Diagram: Network Evolution over Time
### Overview
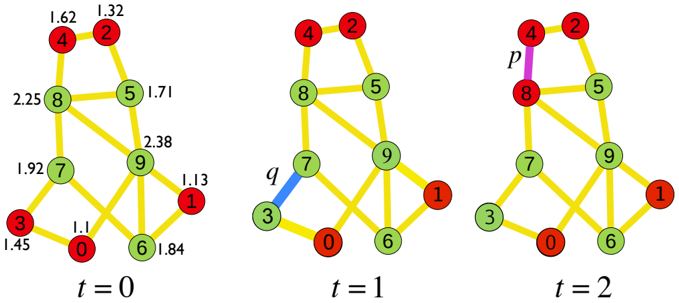
The image presents a series of three network diagrams illustrating the evolution of a network over three time steps (t=0, t=1, and t=2). The network consists of nine nodes, labeled 1 through 9, connected by edges. Each edge is labeled with a numerical value, presumably representing a weight or distance. The diagrams show how the network connections change over time, with some edges appearing, disappearing, or changing their weights.
### Components/Axes
The diagrams do not have traditional axes. They consist of nodes (circles) and edges (lines) connecting the nodes. Each edge has a numerical label. The time step is indicated below each diagram (t=0, t=1, t=2). At t=2, two edges are highlighted in different colors: a purple edge labeled 'p' and a blue edge labeled 'q'.
### Detailed Analysis or Content Details
**t = 0:**
* Nodes: 1, 2, 3, 4, 5, 6, 7, 8, 9
* Edges and Weights:
* 1-6: 1.84
* 1-9: 1.13
* 2-4: 1.62
* 2-8: 1.32
* 3-1: 1.45
* 3-7: 1.92
* 4-2: 1.62
* 4-8: 2.25
* 5-8: 1.71
* 5-9: 2.38
* 6-1: 1.84
* 7-3: 1.92
* 7-9: 2.38
* 8-2: 1.32
* 8-4: 2.25
* 8-5: 1.71
* 9-5: 2.38
* 9-7: 2.38
* 9-1: 1.13
**t = 1:**
* Nodes: 1, 2, 3, 4, 5, 6, 7, 8, 9
* Edges and Weights:
* 1-6: 1.84
* 1-9: 1.13
* 2-4: 1.62
* 2-8: 1.32
* 3-7: 1.92
* 4-2: 1.62
* 4-8: 2.25
* 5-8: 1.71
* 5-9: 2.38
* 6-1: 1.84
* 7-3: 1.92
* 7-9: 2.38
* 8-2: 1.32
* 8-4: 2.25
* 8-5: 1.71
* 9-5: 2.38
* 9-7: 2.38
* 3-7: 1.92 (new edge)
* 3-7: 1.92
* 3-7: 1.92
* Highlighted Edge:
* 3-7: q (blue)
**t = 2:**
* Nodes: 1, 2, 3, 4, 5, 6, 7, 8, 9
* Edges and Weights:
* 1-6: 1.84
* 1-9: 1.13
* 2-4: 1.62
* 2-8: 1.32
* 3-1: 1.45
* 4-2: 1.62
* 4-8: 2.25
* 5-8: 1.71
* 5-9: 2.38
* 6-1: 1.84
* 7-3: 1.92
* 7-9: 2.38
* 8-2: 1.32
* 8-4: 2.25
* 8-5: 1.71
* 9-5: 2.38
* 9-7: 2.38
* Highlighted Edges:
* 3-7: q (blue)
* 4-8: p (purple)
### Key Observations
* The network appears to be relatively stable between t=0 and t=1, with only the addition of the edge 3-7.
* At t=2, the network returns to a configuration similar to t=0, but with the edges 3-7 and 4-8 highlighted.
* The edge weights remain constant throughout the three time steps.
* The highlighted edges 'p' and 'q' at t=2 suggest these edges are of particular interest or are involved in a specific process.
### Interpretation
The diagrams likely represent a dynamic network where connections are formed and potentially broken over time. The edge weights could represent distances, costs, or strengths of relationships between nodes. The evolution from t=0 to t=1 shows the addition of a connection between nodes 3 and 7. The return to a similar configuration at t=2, with the highlighting of edges 'p' and 'q', could indicate a cyclical process or a specific path being emphasized.
The highlighting of edges 'p' and 'q' at t=2 suggests these edges are important for a particular analysis. They might represent critical paths, bottlenecks, or edges involved in a specific event. The network's evolution could be modeling a communication network, a transportation system, or a social network, where connections represent interactions or relationships. The cyclical nature of the changes suggests a dynamic equilibrium or a repeating pattern. The diagram is a visual representation of a network's state at different points in time, allowing for the analysis of its evolution and the identification of key features.