## Chart: Compute-matched analysis: MATH-500
### Overview
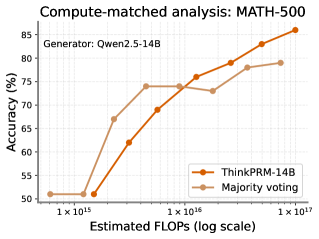
The image is a line chart comparing the accuracy of two methods, "ThinkPRM-14B" and "Majority voting", against the estimated FLOPs (Floating Point Operations per Second) on a logarithmic scale. The chart is titled "Compute-matched analysis: MATH-500" and indicates the generator used is "Qwen2.5-14B".
### Components/Axes
* **Title:** Compute-matched analysis: MATH-500
* **Subtitle:** Generator: Qwen2.5-14B
* **Y-axis:** Accuracy (%)
* Scale ranges from 50 to 85, with tick marks at intervals of 5.
* **X-axis:** Estimated FLOPs (log scale)
* Scale ranges from 1 x 10^15 to 1 x 10^17.
* **Legend:** Located in the bottom-right corner.
* ThinkPRM-14B (represented by an orange line)
* Majority voting (represented by a tan line)
### Detailed Analysis
* **ThinkPRM-14B (Orange Line):**
* Trend: Generally slopes upward, indicating increasing accuracy with higher FLOPs.
* Data Points:
* At 1 x 10^15 FLOPs, accuracy is approximately 51%.
* At approximately 1.5 x 10^15 FLOPs, accuracy is approximately 62%.
* At approximately 2.5 x 10^15 FLOPs, accuracy is approximately 69%.
* At approximately 5 x 10^15 FLOPs, accuracy is approximately 74%.
* At 1 x 10^16 FLOPs, accuracy is approximately 76%.
* At approximately 3 x 10^16 FLOPs, accuracy is approximately 79%.
* At approximately 6 x 10^16 FLOPs, accuracy is approximately 83%.
* At 1 x 10^17 FLOPs, accuracy is approximately 86%.
* **Majority voting (Tan Line):**
* Trend: Generally slopes upward, but plateaus towards the higher FLOPs.
* Data Points:
* At 1 x 10^15 FLOPs, accuracy is approximately 51%.
* At approximately 1.5 x 10^15 FLOPs, accuracy is approximately 67%.
* At approximately 2.5 x 10^15 FLOPs, accuracy is approximately 74%.
* At approximately 5 x 10^15 FLOPs, accuracy is approximately 74%.
* At 1 x 10^16 FLOPs, accuracy is approximately 73%.
* At approximately 3 x 10^16 FLOPs, accuracy is approximately 78%.
* At approximately 6 x 10^16 FLOPs, accuracy is approximately 79%.
### Key Observations
* Both methods start with similar accuracy at lower FLOPs (around 51% at 1 x 10^15 FLOPs).
* ThinkPRM-14B consistently outperforms Majority voting as FLOPs increase, especially at higher FLOPs.
* Majority voting shows a plateau in accuracy improvement beyond 1 x 10^16 FLOPs.
### Interpretation
The data suggests that ThinkPRM-14B scales more effectively with increased computational resources (FLOPs) compared to Majority voting for the MATH-500 task. The plateau in Majority voting's accuracy indicates a potential limitation in its ability to leverage additional computational power, while ThinkPRM-14B continues to improve. This implies that ThinkPRM-14B is a more efficient or better-suited method for this particular task when computational resources are abundant. The "Compute-matched analysis" title suggests that the comparison is controlled for computational cost, making the accuracy difference more meaningful. The generator "Qwen2.5-14B" likely refers to the model used to generate or evaluate the solutions.