## Line Chart: Compute-matched analysis: MATH-500
### Overview
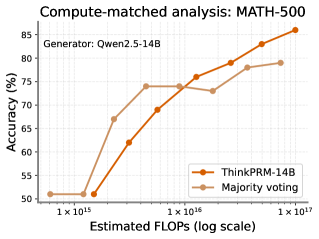
This image presents a line chart comparing the accuracy of two methods, "ThinkPRM-14B" and "Majority voting", as a function of estimated FLOPS (Floating Point Operations Per Second) on the MATH-500 dataset. The chart is designed to show how performance scales with computational resources.
### Components/Axes
* **Title:** Compute-matched analysis: MATH-500
* **Subtitle:** Generator: Qwen2.5-14B
* **X-axis Label:** Estimated FLOPS (log scale)
* **X-axis Scale:** Logarithmic, ranging from approximately 1 x 10<sup>15</sup> to 1 x 10<sup>17</sup>. Markers are at 1 x 10<sup>15</sup>, 5 x 10<sup>15</sup>, 1 x 10<sup>16</sup>, 5 x 10<sup>16</sup>, and 1 x 10<sup>17</sup>.
* **Y-axis Label:** Accuracy (%)
* **Y-axis Scale:** Linear, ranging from 50% to 85%. Markers are at 50%, 55%, 60%, 65%, 70%, 75%, 80%, and 85%.
* **Legend:** Located in the bottom-right corner.
* "ThinkPRM-14B" – Represented by a solid orange line with circular markers.
* "Majority voting" – Represented by a dashed orange line with circular markers.
### Detailed Analysis
**ThinkPRM-14B (Solid Orange Line):**
The line slopes upward, indicating increasing accuracy with increasing FLOPS.
* At 1 x 10<sup>15</sup> FLOPS: Approximately 51% accuracy.
* At 5 x 10<sup>15</sup> FLOPS: Approximately 62% accuracy.
* At 1 x 10<sup>16</sup> FLOPS: Approximately 72% accuracy.
* At 5 x 10<sup>16</sup> FLOPS: Approximately 78% accuracy.
* At 1 x 10<sup>17</sup> FLOPS: Approximately 85% accuracy.
**Majority Voting (Dashed Orange Line):**
The line also slopes upward, but with a different trajectory than ThinkPRM-14B.
* At 1 x 10<sup>15</sup> FLOPS: Approximately 51% accuracy.
* At 5 x 10<sup>15</sup> FLOPS: Approximately 52% accuracy.
* At 1 x 10<sup>16</sup> FLOPS: Approximately 75% accuracy.
* At 5 x 10<sup>16</sup> FLOPS: Approximately 78% accuracy.
* At 1 x 10<sup>17</sup> FLOPS: Approximately 79% accuracy.
### Key Observations
* Both methods show an increase in accuracy with increasing FLOPS.
* ThinkPRM-14B consistently outperforms Majority voting across all FLOPS levels.
* The performance gap between the two methods widens as FLOPS increase, particularly between 1 x 10<sup>15</sup> and 1 x 10<sup>16</sup> FLOPS.
* The accuracy of Majority voting plateaus at higher FLOPS levels (above 1 x 10<sup>16</sup> FLOPS).
### Interpretation
The data suggests that ThinkPRM-14B is a more effective method for solving MATH-500 problems than Majority voting, especially when significant computational resources are available. The increasing accuracy with FLOPS indicates that both methods benefit from increased computational power, but ThinkPRM-14B demonstrates a stronger scaling effect. The plateau in Majority voting's accuracy suggests that its performance is limited by factors other than computational resources, such as the inherent limitations of the voting mechanism itself. The generator used, Qwen2.5-14B, likely influences the performance of ThinkPRM-14B. The chart highlights the trade-off between computational cost and accuracy, and suggests that investing in more FLOPS can lead to substantial improvements in performance for ThinkPRM-14B. The initial low accuracy for both methods at the lowest FLOPS level suggests that a minimum level of computation is required to achieve meaningful results.