\n
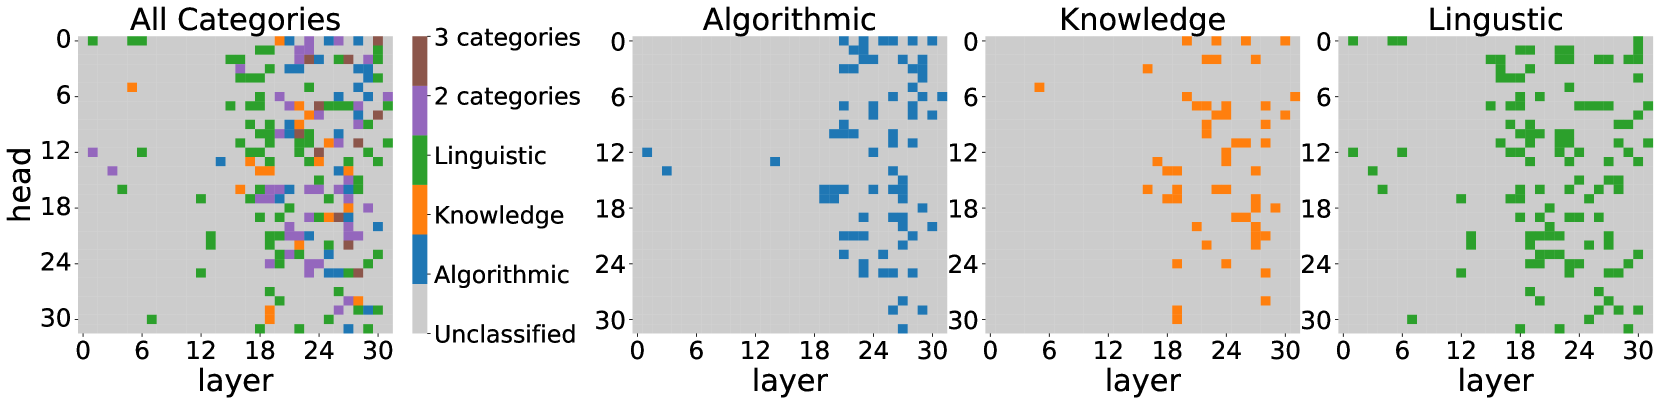
## Scatter Plots: Category Distribution Across Layers and Heads
### Overview
The image presents four scatter plots arranged horizontally. Each plot visualizes the distribution of data points across two dimensions: "layer" (x-axis, ranging from 0 to 30) and "head" (y-axis, ranging from 0 to 30). The first plot shows all categories combined, while the subsequent three plots focus on "Algorithmic", "Knowledge", and "Linguistic" categories respectively. Data points are color-coded to represent different categories.
### Components/Axes
* **X-axis:** "layer" - Scale from 0 to 30, with tick marks at intervals of 6.
* **Y-axis:** "head" - Scale from 0 to 30, with tick marks at intervals of 6.
* **Plot 1 (All Categories):**
* Categories: "Unclassified" (red), "Algorithmic" (blue), "Knowledge" (orange), "Linguistic" (green).
* Label: "All Categories" with "3 categories" and "2 categories" annotations.
* **Plot 2 (Algorithmic):**
* Category: "Algorithmic" (blue).
* Label: "Algorithmic".
* **Plot 3 (Knowledge):**
* Category: "Knowledge" (orange).
* Label: "Knowledge".
* **Plot 4 (Linguistic):**
* Category: "Linguistic" (green).
* Label: "Linguistic".
### Detailed Analysis or Content Details
**Plot 1: All Categories**
* **Unclassified (Red):** Points are scattered throughout the lower-left quadrant (layer 0-12, head 0-18), with a concentration around layer 0-6 and head 0-6. There's a sparse distribution extending to layer 18 and head 12. Approximately 20-30 points.
* **Algorithmic (Blue):** Points are concentrated in the lower-right quadrant (layer 18-30, head 0-12). There's a noticeable cluster around layer 24 and head 6. Approximately 30-40 points.
* **Knowledge (Orange):** Points are primarily located in the upper-right quadrant (layer 12-30, head 6-30). A strong concentration exists around layer 18-24 and head 12-24. Approximately 40-50 points.
* **Linguistic (Green):** Points are distributed across the entire plot, but with a higher density in the upper-left quadrant (layer 0-18, head 12-30). There's a significant cluster around layer 6-12 and head 18-24. Approximately 50-60 points.
**Plot 2: Algorithmic**
* Points are clustered between layer 12 and 24, and head 0 and 12. The density is highest around layer 18-24 and head 6. Approximately 20-30 points.
**Plot 3: Knowledge**
* Points are concentrated between layer 12 and 30, and head 6 and 24. The density is highest around layer 18-24 and head 12-18. Approximately 20-30 points.
**Plot 4: Linguistic**
* Points are distributed between layer 0 and 30, and head 12 and 30. The density is highest around layer 6-18 and head 18-24. Approximately 30-40 points.
### Key Observations
* The "All Categories" plot shows a clear separation of categories based on layer and head values.
* "Algorithmic" data is primarily found in higher layer values.
* "Knowledge" data is concentrated in higher layer and head values.
* "Linguistic" data is more evenly distributed, but with a tendency towards higher head values.
* The "Unclassified" category appears to be more prevalent in lower layer and head values.
### Interpretation
The plots suggest that different categories of data exhibit distinct patterns in the "layer" and "head" dimensions. The "layer" dimension could represent depth or processing stage within a neural network or similar system, while the "head" dimension might represent different attention mechanisms or output features. The separation of categories indicates that these dimensions are useful for distinguishing between different types of information.
The concentration of "Algorithmic" data in higher layers suggests that algorithmic processing occurs later in the system. The distribution of "Knowledge" data indicates that knowledge representation is also more prominent in later stages. The broader distribution of "Linguistic" data suggests that linguistic features are present throughout the system. The "Unclassified" data being concentrated in lower layers could indicate that these are initial, unprocessed inputs.
The plots provide insights into how different categories of information are processed and represented within the system. Further analysis could involve examining the relationships between these categories and the specific features associated with each layer and head. The annotations "3 categories" and "2 categories" on the first plot are unclear without further context, but may refer to the number of distinct clusters or groupings within the data.