## Scatter Plot: Model Accuracy vs. Training FLOPs
### Overview
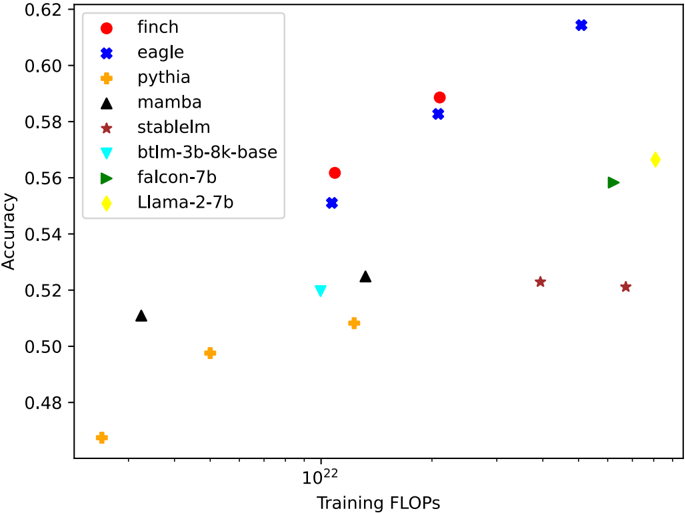
The image is a scatter plot comparing the accuracy of various machine learning models against their training computational cost (measured in FLOPs). The plot uses distinct symbols and colors to represent different models, with a logarithmic scale on the x-axis (Training FLOPs) and a linear scale on the y-axis (Accuracy). The legend is positioned in the top-left corner, and data points are distributed across the plot.
---
### Components/Axes
- **X-axis (Training FLOPs)**: Logarithmic scale ranging from $10^{22}$ to $10^{24}$.
- **Y-axis (Accuracy)**: Linear scale from 0.48 to 0.62.
- **Legend**: Located in the top-left corner, mapping symbols/colors to model names:
- **Red circle**: finch
- **Blue cross**: eagle
- **Yellow plus**: python
- **Black triangle**: mamba
- **Red star**: stablelm
- **Cyan triangle**: btlm-3b-8k-base
- **Green triangle**: falcon-7b
- **Yellow diamond**: Llama-2-7b
---
### Detailed Analysis
#### Data Points and Trends
1. **finch** (red circle):
- Position: ~$10^{23}$ FLOPs, ~0.56 accuracy.
- Trend: Moderate accuracy with mid-range FLOPs.
2. **eagle** (blue cross):
- Position: ~$10^{23}$ FLOPs, ~0.61 accuracy.
- Trend: Highest accuracy among models with ~$10^{23}$ FLOPs.
3. **python** (yellow plus):
- Position: ~$10^{22}$ FLOPs, ~0.49 accuracy.
- Trend: Lowest accuracy and FLOPs.
4. **mamba** (black triangle):
- Position: ~$10^{22}$ FLOPs, ~0.52 accuracy.
- Trend: Slightly higher accuracy than python but similar FLOPs.
5. **stablelm** (red star):
- Position: ~$10^{23}$ FLOPs, ~0.52 accuracy.
- Trend: Lower accuracy than finch and eagle despite similar FLOPs.
6. **btlm-3b-8k-base** (cyan triangle):
- Position: ~$10^{22}$ FLOPs, ~0.52 accuracy.
- Trend: Matches mamba in accuracy but lower FLOPs.
7. **falcon-7b** (green triangle):
- Position: ~$10^{23}$ FLOPs, ~0.55 accuracy.
- Trend: Higher accuracy than stablelm and btlm-3b-8k-base.
8. **Llama-2-7b** (yellow diamond):
- Position: ~$10^{24}$ FLOPs, ~0.56 accuracy.
- Trend: Highest FLOPs but only marginally higher accuracy than finch.
#### Key Observations
- **High FLOPs, High Accuracy**: Models like **eagle** and **finch** achieve the highest accuracy (~0.61 and ~0.56) with ~$10^{23}$ FLOPs.
- **Low FLOPs, Low Accuracy**: **python** and **mamba** have the lowest FLOPs (~$10^{22}$) and accuracy (~0.49–0.52).
- **Outliers**:
- **Llama-2-7b** (yellow diamond) has the highest FLOPs (~$10^{24}$) but only ~0.56 accuracy, suggesting diminishing returns at extreme computational costs.
- **btlm-3b-8k-base** (cyan triangle) and **mamba** (black triangle) show similar accuracy (~0.52) despite differing FLOPs (~$10^{22}$ vs. ~$10^{22}$).
- **No Clear Correlation**: While some models (e.g., eagle, finch) show a positive trend between FLOPs and accuracy, others (e.g., stablelm, Llama-2-7b) deviate, indicating variability in efficiency.
---
### Interpretation
The plot highlights the trade-off between computational cost (FLOPs) and model performance (accuracy). While higher FLOPs generally correlate with better accuracy (e.g., eagle, finch), exceptions like **Llama-2-7b** suggest that efficiency and architectural design play critical roles. Models like **mamba** and **btlm-3b-8k-base** demonstrate that lower FLOPs can achieve competitive accuracy, emphasizing the importance of optimization. The lack of a strict linear relationship implies that factors beyond raw computational power—such as model architecture, training data quality, and algorithmic efficiency—significantly influence outcomes. This underscores the need for balanced approaches in model development, prioritizing both scalability and efficiency.