## Bar Chart: Distribution of Triples per Entity in MetaQA
### Overview
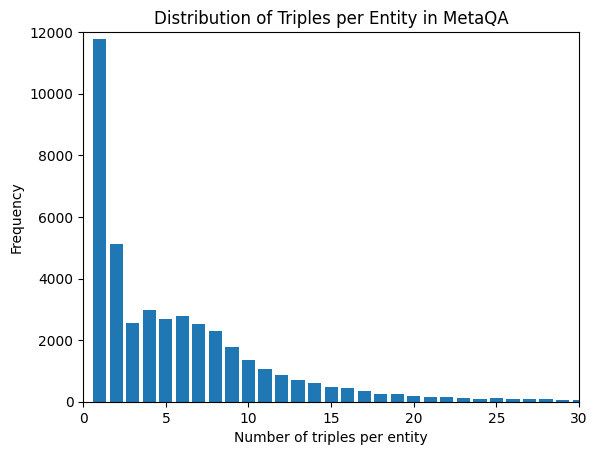
The chart visualizes the frequency distribution of entities in the MetaQA dataset based on the number of triples associated with each entity. The x-axis represents the number of triples per entity (0–30), while the y-axis shows the frequency of entities with that count. The distribution is heavily skewed, with a sharp decline in frequency as the number of triples increases.
### Components/Axes
- **Title**: "Distribution of Triples per Entity in MetaQA" (top-center).
- **X-axis**: "Number of triples per entity" (0–30, increments of 5).
- **Y-axis**: "Frequency" (0–12,000, increments of 2,000).
- **Bars**: Blue, vertical bars representing frequency counts.
- **Legend**: None present.
### Detailed Analysis
- **X-axis Categories**:
- 0 triples: ~11,800 entities.
- 1 triple: ~5,200 entities.
- 2 triples: ~2,800 entities.
- 3 triples: ~3,200 entities.
- 4 triples: ~2,900 entities.
- 5 triples: ~2,700 entities.
- 6 triples: ~2,500 entities.
- 7 triples: ~2,300 entities.
- 8 triples: ~2,100 entities.
- 9 triples: ~1,900 entities.
- 10 triples: ~1,600 entities.
- 11 triples: ~1,300 entities.
- 12 triples: ~1,100 entities.
- 13 triples: ~900 entities.
- 14 triples: ~700 entities.
- 15 triples: ~500 entities.
- 16 triples: ~400 entities.
- 17 triples: ~300 entities.
- 18 triples: ~250 entities.
- 19 triples: ~200 entities.
- 20 triples: ~150 entities.
- 21 triples: ~120 entities.
- 22 triples: ~100 entities.
- 23 triples: ~80 entities.
- 24 triples: ~60 entities.
- 25 triples: ~50 entities.
- 26 triples: ~40 entities.
- 27 triples: ~30 entities.
- 28 triples: ~20 entities.
- 29 triples: ~15 entities.
- 30 triples: ~10 entities.
### Key Observations
1. **Skewed Distribution**: Over 11,800 entities have **0 triples**, far exceeding the next highest category (1 triple: ~5,200).
2. **Rapid Decline**: Frequency drops sharply after 1 triple, with a gradual decline thereafter.
3. **Long Tail**: Only ~10 entities have 30 triples, indicating extreme sparsity for high-triple entities.
4. **Outlier**: The 0-triple category dominates, suggesting many entities lack associated triples.
### Interpretation
The data reveals a **highly imbalanced dataset** where most entities have minimal or no triples. This could indicate:
- **Data sparsity**: Limited triple annotations for many entities.
- **Incomplete knowledge graph**: Entities may exist without sufficient contextual relationships.
- **Potential bias**: Overrepresentation of entities with no triples, possibly due to sampling or annotation constraints.
The long tail highlights the rarity of entities with rich triple representations, which may impact downstream tasks like link prediction or entity resolution in MetaQA. The absence of a legend simplifies interpretation but limits multi-series analysis.