## Bar Chart: Distribution of Triples per Entity in MetaQA
### Overview
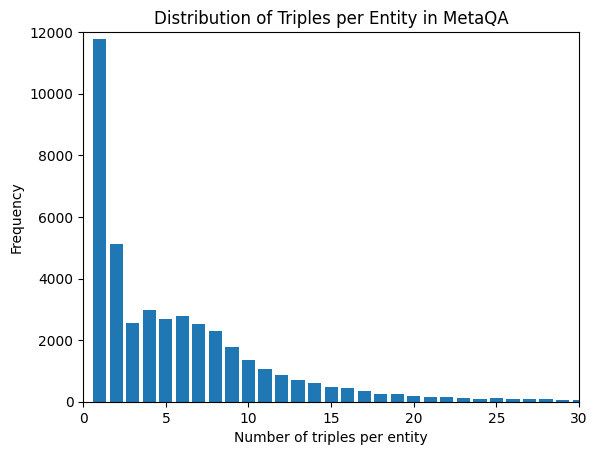
This image is a bar chart (histogram) titled "Distribution of Triples per Entity in MetaQA." It visualizes the frequency distribution of how many knowledge graph triples are associated with each entity within the MetaQA dataset. The chart shows a classic right-skewed (long-tail) distribution, where a vast majority of entities are associated with a small number of triples, and a progressively smaller number of entities are associated with a larger number of triples.
### Components/Axes
* **Title:** "Distribution of Triples per Entity in MetaQA" (centered at the top).
* **X-Axis:** Labeled "Number of triples per entity." It is a linear scale with major tick marks at 0, 5, 10, 15, 20, 25, and 30. The axis represents discrete counts, with bars centered on integer values from 1 to 30.
* **Y-Axis:** Labeled "Frequency." It is a linear scale with major tick marks at 0, 2000, 4000, 6000, 8000, 10000, and 12000. This represents the count of entities.
* **Data Series:** A single series represented by blue vertical bars. There is no legend, as the chart displays one dataset.
* **Spatial Layout:** The chart area is bounded by a black frame. The title is positioned above the frame. The axis labels are centered below the x-axis and to the left of the y-axis (rotated 90 degrees).
### Detailed Analysis
The chart displays the frequency (y-axis) for each discrete number of triples per entity (x-axis). Below are the approximate values extracted from the bar heights. **Note:** Values are approximate, read from the visual scale.
* **1 triple:** ~11,800 entities (The tallest bar, dominating the chart).
* **2 triples:** ~5,100 entities.
* **3 triples:** ~2,500 entities.
* **4 triples:** ~3,000 entities (A slight increase from 3 triples).
* **5 triples:** ~2,700 entities.
* **6 triples:** ~2,800 entities.
* **7 triples:** ~2,500 entities.
* **8 triples:** ~2,300 entities.
* **9 triples:** ~1,800 entities.
* **10 triples:** ~1,400 entities.
* **11 triples:** ~1,100 entities.
* **12 triples:** ~900 entities.
* **13 triples:** ~700 entities.
* **14 triples:** ~600 entities.
* **15 triples:** ~500 entities.
* **16 triples:** ~400 entities.
* **17 triples:** ~350 entities.
* **18 triples:** ~300 entities.
* **19 triples:** ~250 entities.
* **20 triples:** ~200 entities.
* **21-30 triples:** The frequencies continue to decline steadily, with each subsequent bar being slightly shorter than the last. By 30 triples, the frequency is very low, appearing to be less than 100 entities.
**Trend Verification:** The visual trend is a steep, exponential-like decay from 1 to 3 triples, followed by a more gradual, roughly linear decline from 4 triples onward. There is a minor local peak at 4 triples.
### Key Observations
1. **Extreme Right Skew:** The distribution is heavily skewed to the right. The single category of entities with only 1 triple accounts for the largest proportion of all entities.
2. **Dominance of Low-Connectivity Entities:** The vast majority of entities in the MetaQA dataset have a low number of associated triples (fewer than 10).
3. **Long Tail:** A significant "long tail" exists, showing that while rare, some entities are highly connected, with up to 30 or more triples.
4. **Minor Anomaly at 4 Triples:** There is a small but noticeable increase in frequency at 4 triples compared to 3 triples, breaking the otherwise smooth decline. This could be a dataset-specific characteristic.
### Interpretation
This distribution is characteristic of many real-world networks and knowledge graphs, often following a power-law or scale-free pattern. It suggests that the MetaQA knowledge graph is structured with a core of highly connected "hub" entities (those in the long tail) and a periphery of many sparsely connected entities.
* **Data Implication:** The high frequency of entities with only 1 triple indicates that many concepts in the dataset are only mentioned in a single relational context. This could pose challenges for machine learning models that rely on multi-hop reasoning or require rich contextual information about an entity.
* **Structural Insight:** The presence of entities with 20-30 triples suggests the existence of central, well-defined concepts (e.g., major characters, key locations, or core events in a narrative domain) around which many facts are organized.
* **Anomaly Consideration:** The slight bump at 4 triples might indicate a common pattern or a specific subset of entities that naturally participate in four types of relationships within the dataset's domain. Further investigation into the dataset's schema would be needed to confirm this.
In summary, the chart reveals a knowledge graph where connectivity is highly unequal, dominated by many weakly connected entities and a few strongly connected ones, which is a fundamental property to consider when using MetaQA for tasks like question answering or link prediction.