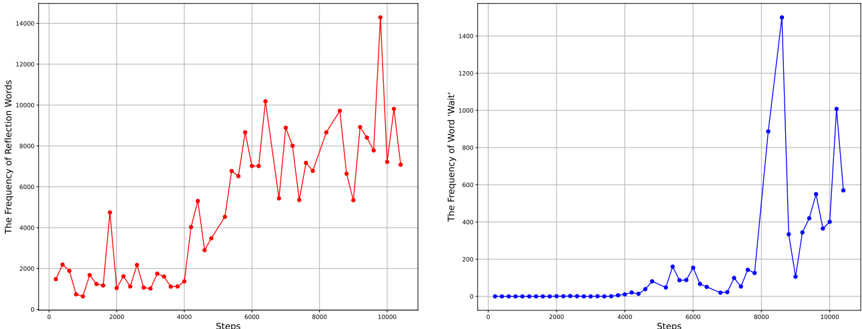
## Chart: Frequency of Words Over Steps
### Overview
The image presents two line charts side-by-side. The left chart displays the frequency of "Reflection Words" over a series of steps, while the right chart shows the frequency of the word "Wait" over the same steps. Both charts share the same x-axis ("Steps") but have different y-axes representing the frequency of the respective words.
### Components/Axes
**Left Chart:**
* **Title:** The Frequency of Reflection Words
* **X-axis:** Steps, ranging from 0 to 10000, with gridlines at intervals of 2000.
* **Y-axis:** The Frequency of Reflection Words, ranging from 0 to 14000, with gridlines at intervals of 2000.
* **Data Series:** A red line representing the frequency of "Reflection Words".
**Right Chart:**
* **Title:** The Frequency of Word 'Wait'
* **X-axis:** Steps, ranging from 0 to 10000, with gridlines at intervals of 2000.
* **Y-axis:** The Frequency of Word 'Wait', ranging from 0 to 1400, with gridlines at intervals of 200.
* **Data Series:** A blue line representing the frequency of the word "Wait".
### Detailed Analysis
**Left Chart (Reflection Words):**
* **Trend:** The frequency of "Reflection Words" starts relatively low, fluctuates, and then increases significantly after approximately step 4000. It continues to fluctuate at a higher level until step 10000.
* **Data Points:**
* Step 0: Approximately 1500
* Step 2000: Approximately 4800
* Step 4000: Approximately 1200
* Step 6000: Approximately 6800
* Step 8000: Approximately 7000
* Step 10000: Approximately 8000
**Right Chart (Word 'Wait'):**
* **Trend:** The frequency of the word "Wait" remains very low until approximately step 4000. After that, it increases, with a sharp spike around step 8000, followed by a decrease and then another increase towards step 10000.
* **Data Points:**
* Step 0: Approximately 20
* Step 4000: Approximately 20
* Step 6000: Approximately 100
* Step 8000: Approximately 1400
* Step 10000: Approximately 1000
### Key Observations
* The frequency of "Reflection Words" shows a general increasing trend after step 4000, with significant fluctuations.
* The frequency of the word "Wait" remains low until step 4000, after which it experiences a dramatic spike and subsequent fluctuations.
* Both charts show a change in behavior around step 4000, suggesting a potential shift in the underlying process being measured.
### Interpretation
The charts suggest that the frequency of "Reflection Words" and the word "Wait" are correlated with the "Steps" variable. The increase in both frequencies after step 4000 could indicate a change in the system or process being observed. The spike in the frequency of "Wait" around step 8000 is a notable outlier, suggesting a specific event or condition at that point. The data implies that the process might have different phases or states, with the initial phase (before step 4000) characterized by low frequencies of both word types, and a later phase (after step 4000) characterized by higher and more variable frequencies. Further investigation would be needed to understand the nature of the "Steps" variable and the reasons for the observed changes in word frequencies.