\n
## Line Charts: Frequency of Words Over Steps
### Overview
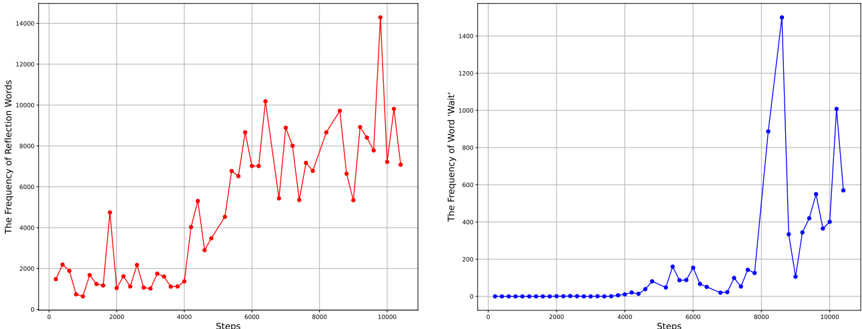
The image presents two line charts displayed side-by-side. The left chart shows the frequency of "Reflection Words" over "Steps", while the right chart displays the frequency of the word "Wait" over the same "Steps" axis. Both charts use a grid background for readability.
### Components/Axes
* **X-axis (Both Charts):** "Steps". Scale ranges from 0 to 10000, with tick marks at 2000, 4000, 6000, 8000, and 10000.
* **Y-axis (Left Chart):** "The Frequency of Reflection Words". Scale ranges from 0 to 14000, with tick marks at intervals of approximately 2000.
* **Y-axis (Right Chart):** "The Frequency of Word 'Wait'". Scale ranges from 0 to 14000, with tick marks at intervals of approximately 200.
* **Line 1 (Left Chart):** Red line representing the frequency of "Reflection Words".
* **Line 1 (Right Chart):** Blue line representing the frequency of the word "Wait".
### Detailed Analysis or Content Details
**Left Chart: Reflection Words**
The red line representing "Reflection Words" exhibits a generally increasing trend with significant fluctuations.
* At Step 0, the frequency is approximately 1000.
* Around Step 1000, there's a peak at approximately 3500.
* The frequency dips to around 1500 at Step 2000.
* A peak occurs around Step 3000 at approximately 3000.
* The frequency fluctuates between 2000 and 6000 until Step 7000.
* A significant peak is observed at Step 10000, reaching approximately 14000.
**Right Chart: Word "Wait"**
The blue line representing the frequency of "Wait" starts low and gradually increases, then experiences a sharp spike.
* From Step 0 to approximately Step 4000, the frequency remains very low, around 50-100.
* The frequency begins to increase around Step 4000, reaching approximately 200 at Step 6000.
* A sharp increase occurs between Step 7000 and Step 8000, peaking at approximately 14000.
* The frequency drops to approximately 800 at Step 9000 and stabilizes around 1000 at Step 10000.
### Key Observations
* The frequency of "Reflection Words" is consistently higher than the frequency of "Wait" for most of the observed steps, except for a brief period near Step 8000.
* The "Wait" frequency exhibits a much more dramatic and sudden increase than the "Reflection Words" frequency.
* Both charts show a general trend of increasing frequency as the number of steps increases, but the "Wait" chart's increase is far more pronounced at the end.
* The "Reflection Words" chart shows a more chaotic, fluctuating pattern, while the "Wait" chart is relatively stable until the final spike.
### Interpretation
The data suggests a potential correlation between the progression of "Steps" and the use of both "Reflection Words" and the word "Wait". The increasing frequency of "Reflection Words" could indicate a growing level of introspection or analysis as the process continues. The sudden spike in "Wait" frequency near Step 8000 is particularly noteworthy. This could signify a point where the process encounters a bottleneck, requires external input, or experiences a delay. The contrasting patterns suggest that "Reflection Words" are used more consistently throughout the process, while "Wait" is reserved for specific moments of pause or anticipation. The fact that the "Wait" frequency surpasses the "Reflection Words" frequency at the end suggests that waiting becomes the dominant activity towards the conclusion of the process. Further investigation would be needed to understand the context of these "Steps" and the meaning of these words within that context.