## Line Graphs: Frequency of Reflection Words vs. Word "Wait"
### Overview
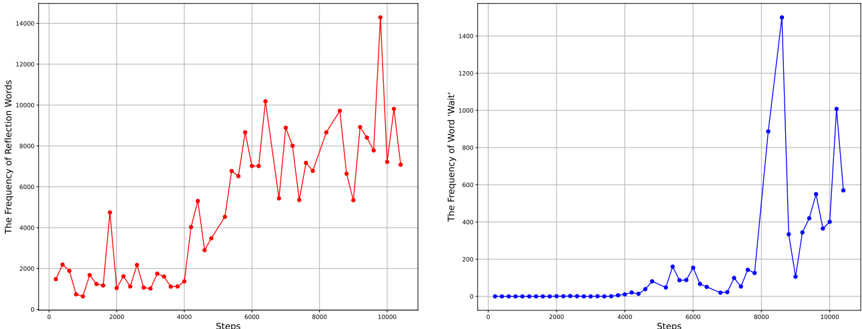
The image contains two line graphs side by side. The left graph (red line) tracks "The Frequency of Reflection Words" across steps, while the right graph (blue line) tracks "The Frequency of Word 'Wait'". Both axes are labeled, and legends are positioned on the right.
### Components/Axes
- **X-axis (both graphs)**: Labeled "Steps", with markers at 0, 2000, 4000, 6000, 8000, and 10,000.
- **Y-axis (left graph)**: Labeled "The Frequency of Reflection Words", with approximate values ranging from 0 to 14,000.
- **Y-axis (right graph)**: Labeled "The Frequency of Word 'Wait'", with approximate values ranging from 0 to 1,400.
- **Legends**:
- Red line: "The Frequency of Reflection Words" (left graph).
- Blue line: "The Frequency of Word 'Wait'" (right graph).
### Detailed Analysis
#### Left Graph (Red Line: Reflection Words)
- **Trend**: The red line exhibits significant volatility, with multiple peaks and troughs.
- **Early Steps (0–2000)**: Starts at ~1,500, dips to ~500, then spikes to ~4,500 at step 2000.
- **Mid Steps (2000–6000)**: Oscillates between ~1,000 and ~8,000, with a notable peak at ~10,000 near step 6000.
- **Late Steps (6000–10,000)**: Peaks sharply at ~14,000 near step 10,000, then drops to ~7,000.
- **Key Data Points**:
- Step 0: ~1,500
- Step 2000: ~4,500
- Step 6000: ~10,000
- Step 10,000: ~14,000
#### Right Graph (Blue Line: Word "Wait")
- **Trend**: The blue line remains near 0 until step 8,000, then surges sharply.
- **Early Steps (0–8000)**: Stays flat at ~0.
- **Mid Steps (8000–10,000)**: Spikes to ~1,400 at step 8,000, drops to ~300 at step 9,000, then rises again to ~1,000 at step 10,000.
- **Key Data Points**:
- Step 8000: ~1,400
- Step 9000: ~300
- Step 10,000: ~1,000
### Key Observations
1. **Red Line (Reflection Words)**:
- High variability with no clear pattern, suggesting inconsistent focus on reflection words.
- A dramatic spike at step 10,000 indicates a sudden emphasis on reflection words.
2. **Blue Line (Word "Wait")**:
- Minimal activity until step 8,000, followed by a sharp, delayed increase.
- The spike at step 8,000 is the highest point, suggesting a critical moment of focus on "wait".
### Interpretation
- The red line’s erratic behavior may reflect fluctuating attention to reflection-related content, possibly due to external factors (e.g., topic shifts, user behavior).
- The blue line’s delayed spike implies that the word "wait" gained prominence only after a prolonged period of inactivity, potentially signaling a pivotal event or decision point at step 8,000.
- The lack of correlation between the two lines suggests they represent distinct phenomena, possibly from different data sources or contexts.
- The red line’s final drop after step 10,000 could indicate a resolution or conclusion to the reflected content, while the blue line’s persistence hints at lingering focus on "wait".