## Combined Bar and Line Chart: Latency vs. Accuracy for Top-K Values
### Overview
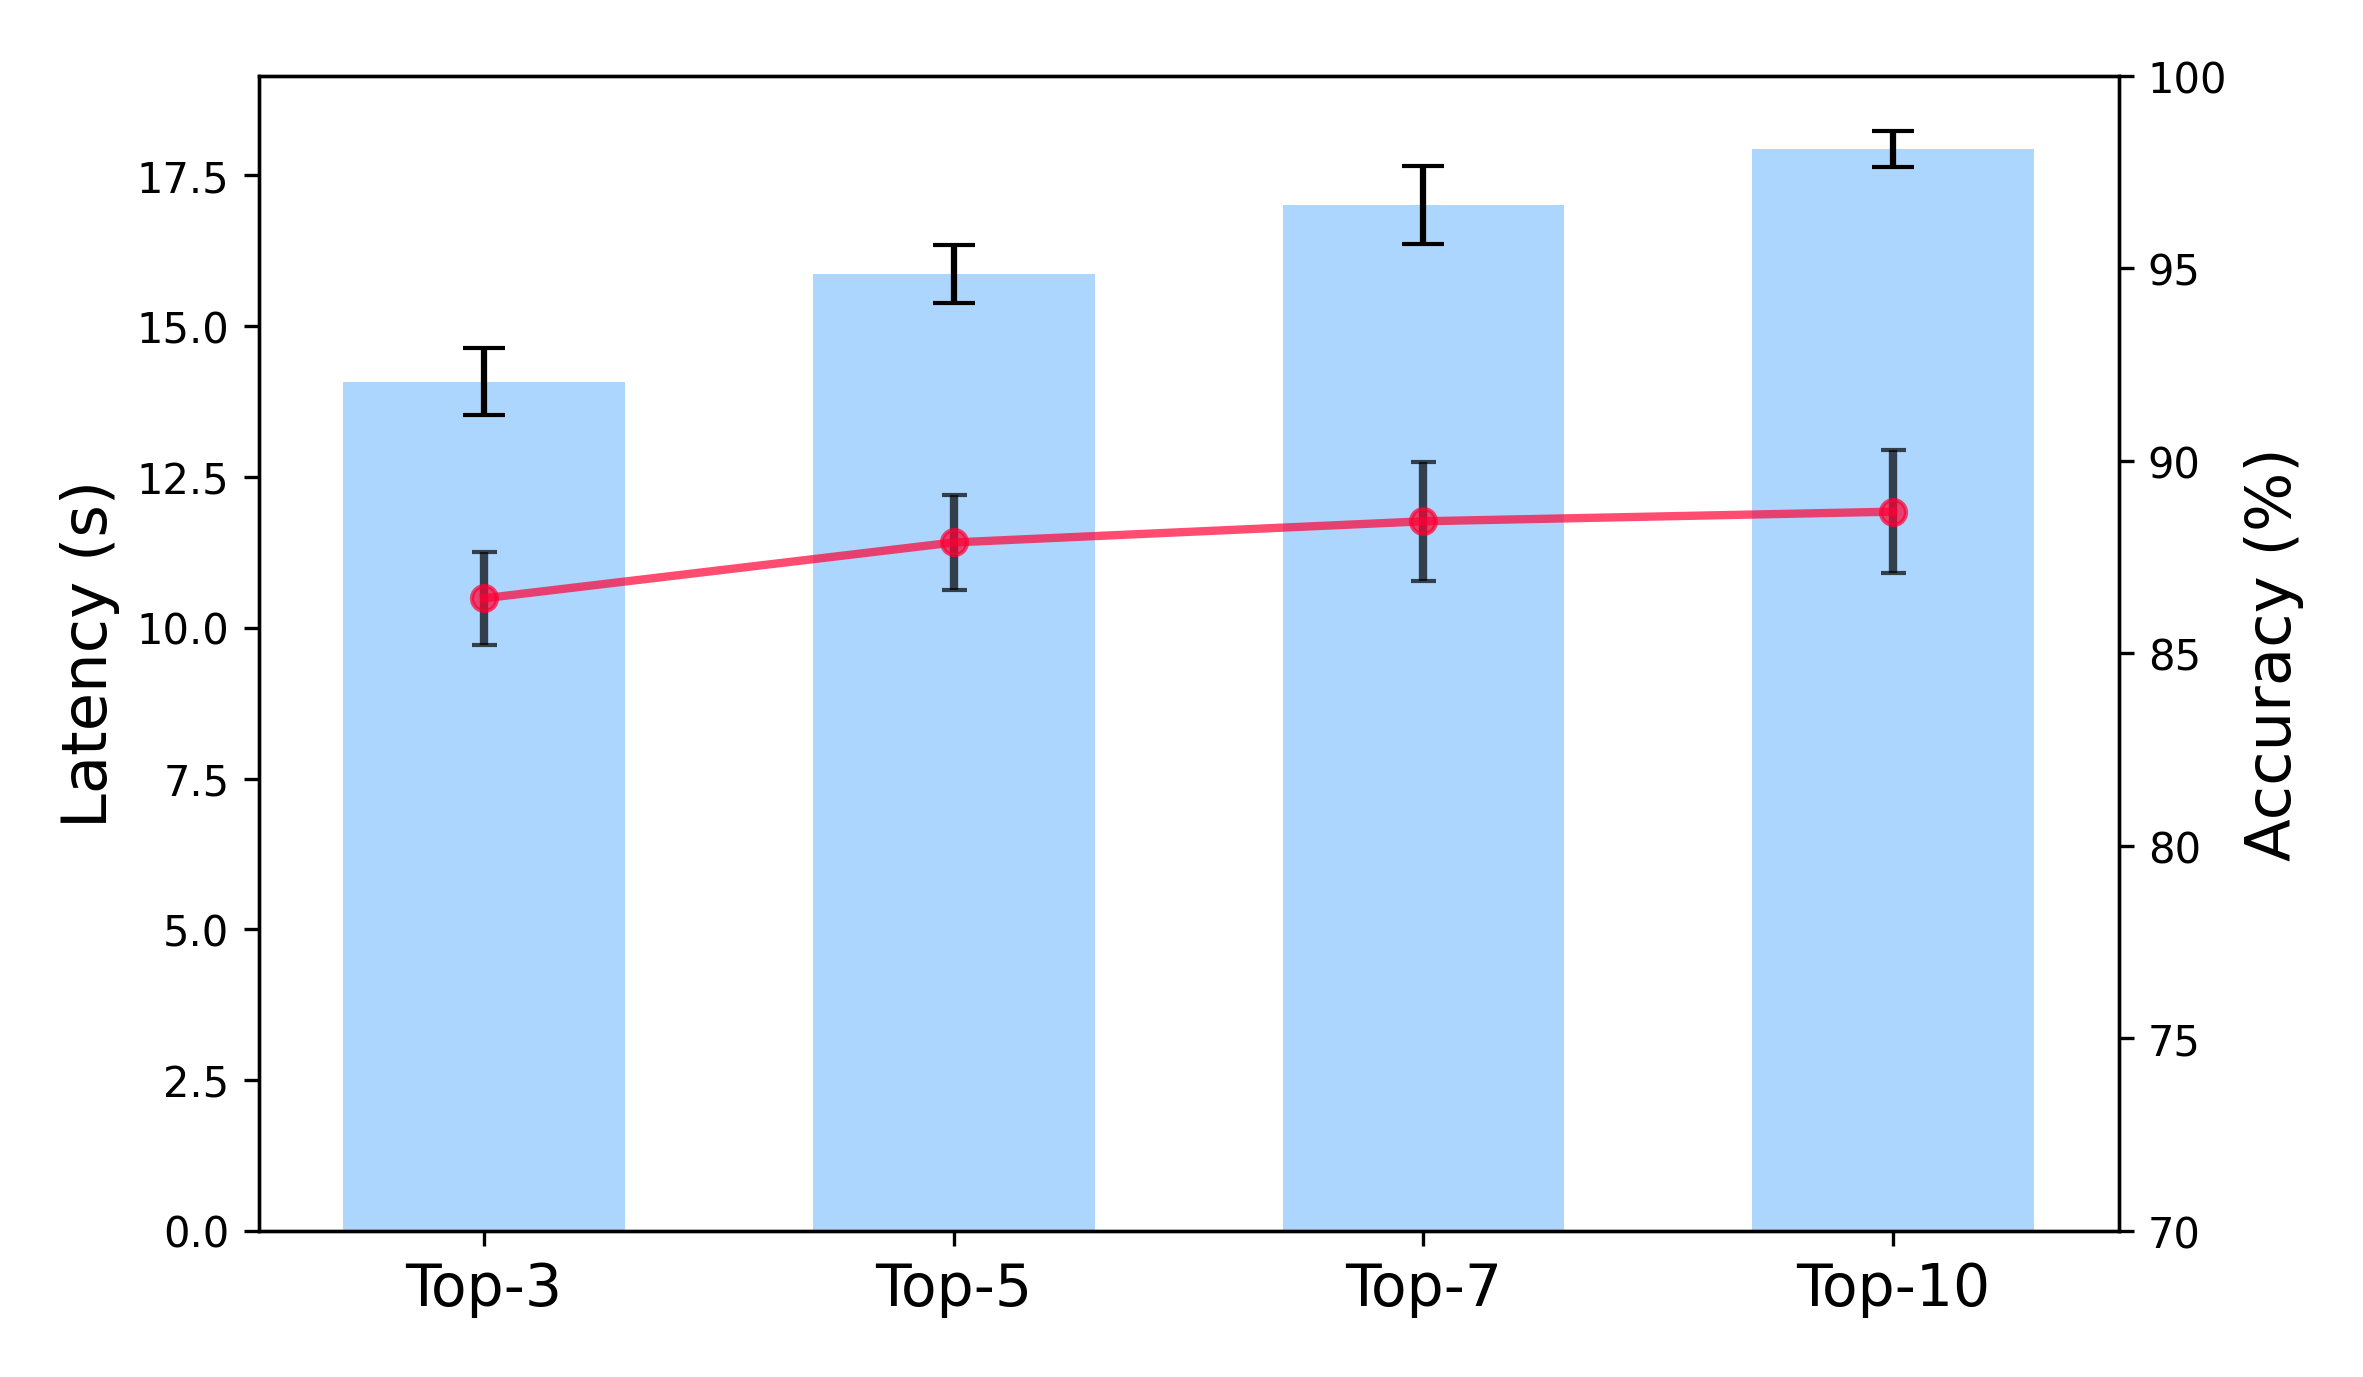
The image is a combined bar and line chart comparing latency (in seconds) and accuracy (in percentage) for different "Top-K" values (Top-3, Top-5, Top-7, and Top-10). The latency is represented by light blue bars, while the accuracy is represented by a red line with circular markers. Error bars are present for both latency and accuracy.
### Components/Axes
* **X-axis:** Categorical axis labeled "Top-3", "Top-5", "Top-7", and "Top-10".
* **Left Y-axis:** Numerical axis labeled "Latency (s)", ranging from 0.0 to 17.5 in increments of 2.5.
* **Right Y-axis:** Numerical axis labeled "Accuracy (%)", ranging from 70 to 100 in increments of 5.
* **Latency Data:** Represented by light blue bars with black error bars.
* **Accuracy Data:** Represented by a red line with circular markers and black error bars.
### Detailed Analysis
* **Latency (Light Blue Bars):**
* Top-3: Approximately 14.0 s, with an error range of approximately +/- 0.7 s.
* Top-5: Approximately 16.0 s, with an error range of approximately +/- 0.6 s.
* Top-7: Approximately 17.0 s, with an error range of approximately +/- 0.7 s.
* Top-10: Approximately 18.0 s, with an error range of approximately +/- 0.6 s.
* **Trend:** The latency generally increases as the "Top-K" value increases.
* **Accuracy (Red Line):**
* Top-3: Approximately 87%, with an error range of approximately +/- 2%.
* Top-5: Approximately 88%, with an error range of approximately +/- 2%.
* Top-7: Approximately 89%, with an error range of approximately +/- 2%.
* Top-10: Approximately 89%, with an error range of approximately +/- 2%.
* **Trend:** The accuracy shows a slight increase from Top-3 to Top-7, then plateaus between Top-7 and Top-10.
### Key Observations
* Latency increases consistently with increasing "Top-K" values.
* Accuracy increases slightly from Top-3 to Top-7, then remains relatively stable.
* The error bars indicate the variability in both latency and accuracy.
### Interpretation
The chart suggests a trade-off between latency and accuracy when choosing the "Top-K" value. Increasing the "Top-K" value (e.g., from Top-3 to Top-10) leads to a higher accuracy, but also results in a higher latency. The choice of the optimal "Top-K" value would depend on the specific application and the relative importance of latency and accuracy. The relatively flat accuracy from Top-7 to Top-10 suggests that there may be diminishing returns in terms of accuracy beyond Top-7, while the latency continues to increase.