## Dual-Axis Bar and Line Chart: Latency vs. Accuracy for Top-N Selection
### Overview
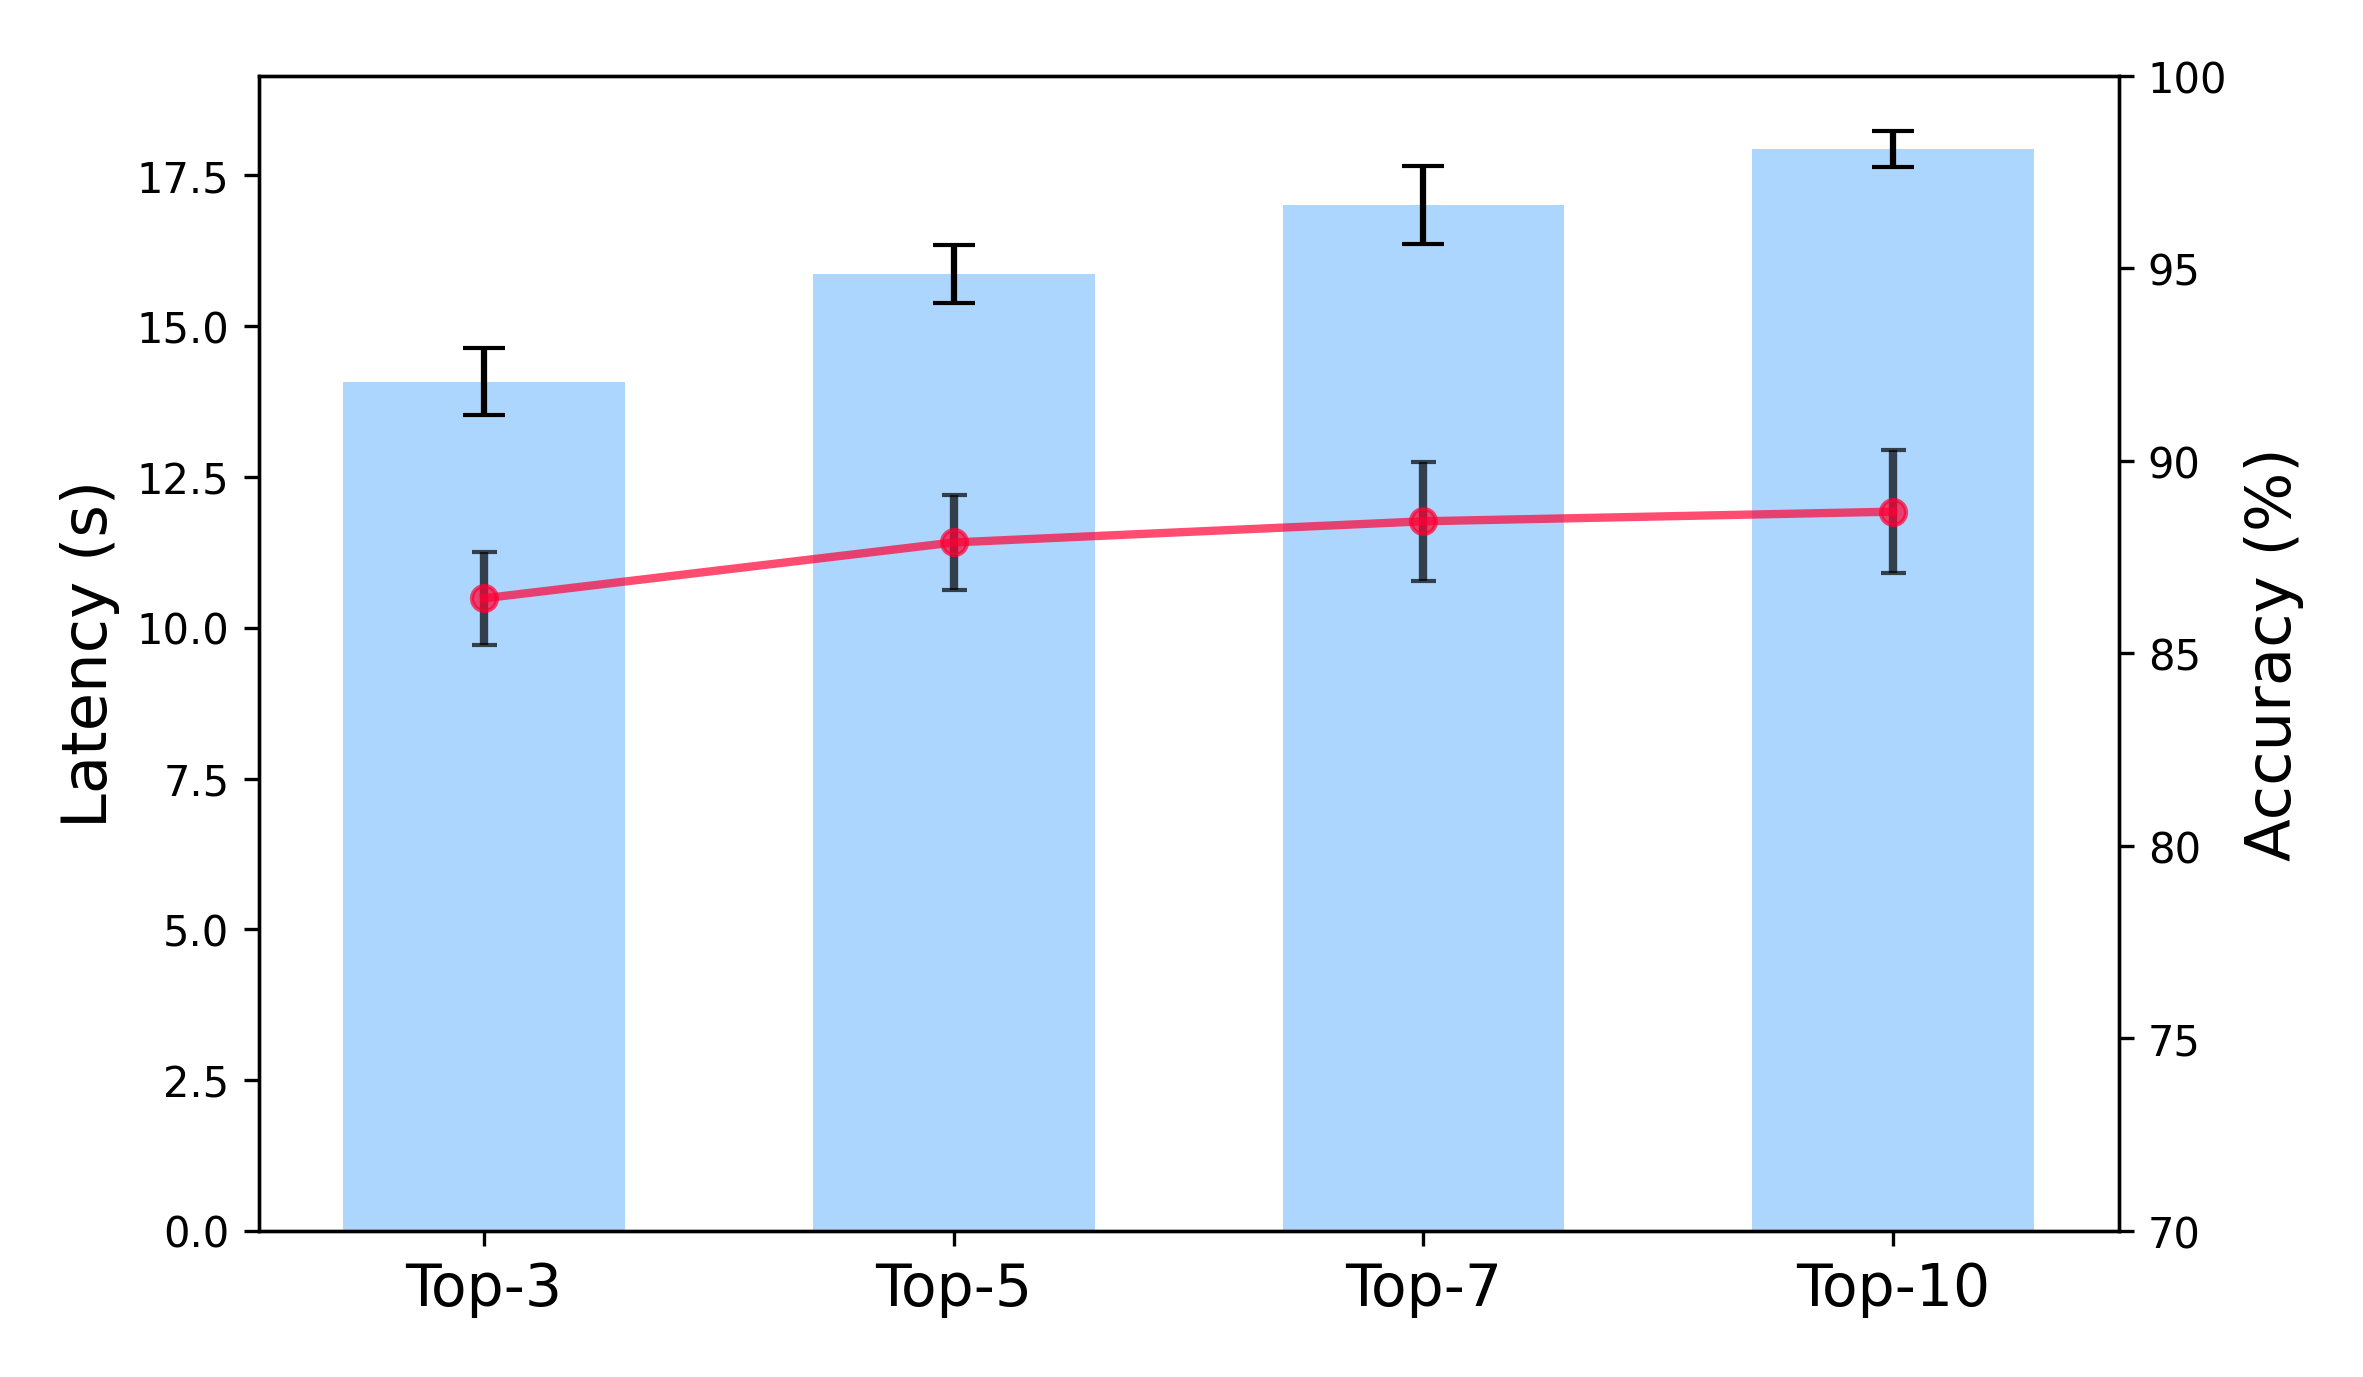
This image displays a dual-axis combination chart comparing two performance metrics—Latency (in seconds) and Accuracy (in percentage)—across four different "Top-N" selection categories (Top-3, Top-5, Top-7, Top-10). The chart uses light blue bars to represent latency and a red line with markers to represent accuracy. Both data series include error bars, indicating variability or confidence intervals.
### Components/Axes
* **X-Axis (Categorical):** Labeled with four categories: "Top-3", "Top-5", "Top-7", "Top-10". These are positioned along the bottom of the chart.
* **Primary Y-Axis (Left, for Latency):** Labeled "Latency (s)". The scale runs from 0.0 to approximately 18.0, with major tick marks at 0.0, 2.5, 5.0, 7.5, 10.0, 12.5, 15.0, and 17.5.
* **Secondary Y-Axis (Right, for Accuracy):** Labeled "Accuracy (%)". The scale runs from 70 to 100, with major tick marks at 70, 75, 80, 85, 90, 95, and 100.
* **Data Series 1 (Bars):** Light blue vertical bars represent the Latency value for each category. Each bar has a black error bar extending vertically from its top.
* **Data Series 2 (Line):** A solid red line connects circular red markers, representing the Accuracy value for each category. Each marker has a black error bar extending vertically through it.
* **Legend:** There is no explicit legend box present in the chart. The association of the blue bars with the left "Latency (s)" axis and the red line with the right "Accuracy (%)" axis is inferred from the axis labels and standard charting conventions.
### Detailed Analysis
**Trend Verification:**
* **Latency (Blue Bars):** The height of the bars shows a clear, consistent upward trend from left to right. Latency increases as the "N" in "Top-N" increases.
* **Accuracy (Red Line):** The red line also shows a consistent upward trend from left to right, though the slope appears slightly less steep than the latency increase. Accuracy improves as "N" increases.
**Data Point Extraction (Approximate Values):**
* **Top-3:**
* Latency: ~14.0 seconds (Bar height). Error bar spans approximately 13.5 to 14.5 seconds.
* Accuracy: ~87% (Red marker). Error bar spans approximately 86% to 88%.
* **Top-5:**
* Latency: ~15.8 seconds. Error bar spans approximately 15.3 to 16.3 seconds.
* Accuracy: ~88.5%. Error bar spans approximately 87.5% to 89.5%.
* **Top-7:**
* Latency: ~17.0 seconds. Error bar spans approximately 16.5 to 17.5 seconds.
* Accuracy: ~89%. Error bar spans approximately 88% to 90%.
* **Top-10:**
* Latency: ~18.0 seconds. Error bar spans approximately 17.5 to 18.5 seconds.
* Accuracy: ~89.5%. Error bar spans approximately 88.5% to 90.5%.
### Key Observations
1. **Positive Correlation:** Both latency and accuracy increase monotonically with the "Top-N" parameter. Considering more candidates (higher N) leads to better accuracy but at the cost of higher processing time.
2. **Diminishing Returns on Accuracy:** The improvement in accuracy appears to slow down as N increases. The jump from Top-3 to Top-5 (~1.5%) is larger than the jump from Top-7 to Top-10 (~0.5%).
3. **Linear Latency Increase:** The increase in latency appears relatively linear across the categories, suggesting a roughly constant additional processing cost per added candidate.
4. **Error Bar Consistency:** The size of the error bars (variability) for both metrics appears relatively consistent across all categories, indicating stable measurement variance.
### Interpretation
This chart illustrates a classic performance trade-off in a selection or retrieval system (e.g., a recommendation engine, search algorithm, or classification model). The "Top-N" parameter controls how many top-ranked items are considered for a final decision or output.
* **The Trade-off:** The data demonstrates that expanding the candidate pool (increasing N) yields a more accurate result, as the system has a better chance of including the correct item. However, this accuracy gain comes with a direct and significant cost in computational latency. The system takes longer to process and evaluate more candidates.
* **Operational Implication:** The choice of an optimal "N" is not purely technical but depends on the application's requirements. A real-time system (e.g., live video analysis) might prioritize low latency and choose Top-3 or Top-5, accepting slightly lower accuracy. A batch processing system where accuracy is paramount (e.g., medical image analysis) might opt for Top-10 despite the higher latency.
* **Diminishing Returns:** The flattening accuracy curve suggests that beyond a certain point (perhaps Top-7 or Top-10), the marginal gain in accuracy may not justify the additional latency cost. This insight is crucial for system optimization, indicating a potential point of optimal efficiency.
* **Underlying System Behavior:** The linear latency increase suggests the processing time per candidate is roughly constant. The consistent error bars imply the system's performance variability is stable and not exacerbated by considering more candidates.