## Bar Chart: Multiple-Choice Accuracy by Problem Type and Method
### Overview
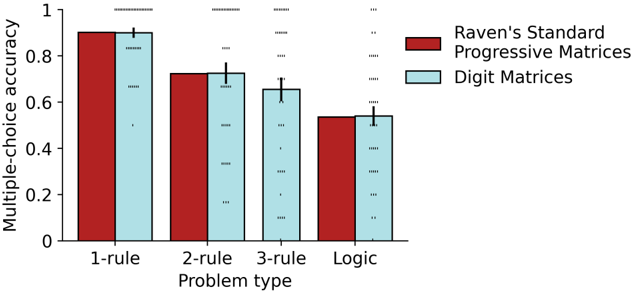
The chart compares multiple-choice accuracy across four problem types (1-rule, 2-rule, 3-rule, Logic) using two methods: Raven's Standard Progressive Matrices (red bars) and Digit Matrices (blue bars). Accuracy is measured on a scale from 0 to 1, with error bars indicating variability.
### Components/Axes
- **X-axis**: Problem types (1-rule, 2-rule, 3-rule, Logic), evenly spaced.
- **Y-axis**: Multiple-choice accuracy (0 to 1.0), with increments of 0.2.
- **Legend**:
- Red = Raven's Standard Progressive Matrices
- Blue = Digit Matrices
- **Error Bars**: Small vertical lines atop each bar, representing standard deviation.
### Detailed Analysis
- **1-rule**:
- Raven's: ~0.90 (±0.02)
- Digit Matrices: ~0.90 (±0.02)
- **2-rule**:
- Raven's: ~0.73 (±0.03)
- Digit Matrices: ~0.72 (±0.03)
- **3-rule**:
- Raven's: ~0.66 (±0.04)
- Digit Matrices: ~0.65 (±0.04)
- **Logic**:
- Raven's: ~0.55 (±0.05)
- Digit Matrices: ~0.54 (±0.05)
### Key Observations
1. **Consistent Superiority**: Raven's method outperforms Digit Matrices across all problem types, though the gap narrows in Logic problems.
2. **Accuracy Decline**: Both methods show reduced accuracy as problem complexity increases (1-rule to Logic).
3. **Error Margins**: Error bars are smallest for 1-rule problems and largest for Logic, suggesting higher variability in complex tasks.
### Interpretation
The data demonstrates that Raven's Standard Progressive Matrices are more effective than Digit Matrices for solving multiple-choice problems, particularly in simpler tasks (1-rule). The minimal difference in Logic problems suggests Digit Matrices may approach Raven's performance in highly complex scenarios. The gradual decline in accuracy with increasing problem complexity highlights the challenges of adapting these methods to more abstract reasoning tasks. The error bars indicate that measurements are relatively precise, though variability increases with problem difficulty.