\n
## Bar Chart: Multiple-Choice Accuracy vs. Problem Type
### Overview
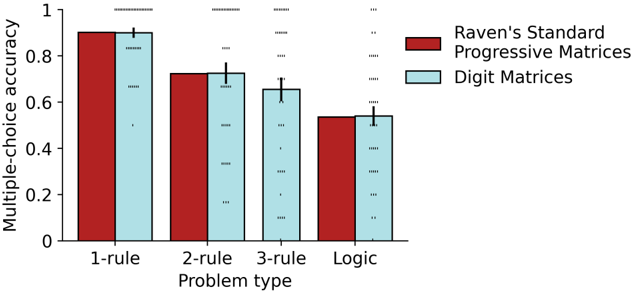
This bar chart compares the multiple-choice accuracy scores for two types of matrices – Raven’s Standard Progressive Matrices and Digit Matrices – across four different problem types: 1-rule, 2-rule, 3-rule, and Logic. Error bars are present on each bar, indicating the variability in the data. Statistical significance is indicated by asterisks above the bars.
### Components/Axes
* **X-axis:** "Problem type" with categories: 1-rule, 2-rule, 3-rule, Logic.
* **Y-axis:** "Multiple-choice accuracy" ranging from 0 to 1.
* **Data Series:**
* Raven’s Standard Progressive Matrices (represented by dark red bars)
* Digit Matrices (represented by light blue bars)
* **Legend:** Located in the top-right corner, clearly labeling the two data series with their corresponding colors.
* **Error Bars:** Black lines extending vertically from the top of each bar, indicating standard error or confidence intervals.
* **Significance Markers:** Asterisks ("*") above the bars, indicating statistical significance. The number of asterisks likely corresponds to the p-value (e.g., one asterisk for p < 0.05, four asterisks for p < 0.0001).
### Detailed Analysis
Let's analyze each data series and problem type:
**Raven’s Standard Progressive Matrices (Dark Red)**
* **1-rule:** Accuracy is approximately 0.92. (Visual trend: Highest accuracy)
* **2-rule:** Accuracy is approximately 0.74. (Visual trend: Decreasing accuracy)
* **3-rule:** Accuracy is approximately 0.68. (Visual trend: Further decreasing accuracy)
* **Logic:** Accuracy is approximately 0.56. (Visual trend: Lowest accuracy)
**Digit Matrices (Light Blue)**
* **1-rule:** Accuracy is approximately 0.87. (Visual trend: High accuracy, slightly lower than Raven's)
* **2-rule:** Accuracy is approximately 0.71. (Visual trend: Decreasing accuracy, similar to Raven's)
* **3-rule:** Accuracy is approximately 0.64. (Visual trend: Further decreasing accuracy, similar to Raven's)
* **Logic:** Accuracy is approximately 0.52. (Visual trend: Lowest accuracy, similar to Raven's)
**Statistical Significance:**
* All bars have asterisks indicating statistical significance. The number of asterisks suggests a high level of significance (p < 0.0001) for all comparisons.
### Key Observations
* Accuracy decreases as the complexity of the problem type increases (from 1-rule to Logic) for both Raven’s and Digit Matrices.
* Raven’s Standard Progressive Matrices consistently show slightly higher accuracy than Digit Matrices across all problem types.
* The difference in accuracy between the two matrix types appears relatively consistent across all problem types.
* The error bars are relatively small, suggesting that the data is fairly consistent within each group.
### Interpretation
The data suggests that both Raven’s Standard Progressive Matrices and Digit Matrices are sensitive to problem complexity. As the number of rules required to solve the problem increases, accuracy decreases. This indicates that both types of matrices assess similar cognitive abilities related to abstract reasoning and pattern recognition. The consistently higher accuracy scores for Raven’s Matrices suggest that they may be slightly more sensitive or easier to solve than Digit Matrices, potentially due to the nature of the stimuli (abstract shapes vs. numbers). The high statistical significance across all comparisons indicates that these differences are unlikely to be due to chance. This chart demonstrates a clear negative correlation between problem complexity and accuracy for both matrix types, highlighting the importance of considering task difficulty when assessing cognitive abilities. The consistent pattern across both matrix types suggests a general principle of cognitive processing rather than a specific characteristic of either task.