## Chart/Diagram Type: Multi-Panel Comparison of Regimes and Datasets
### Overview
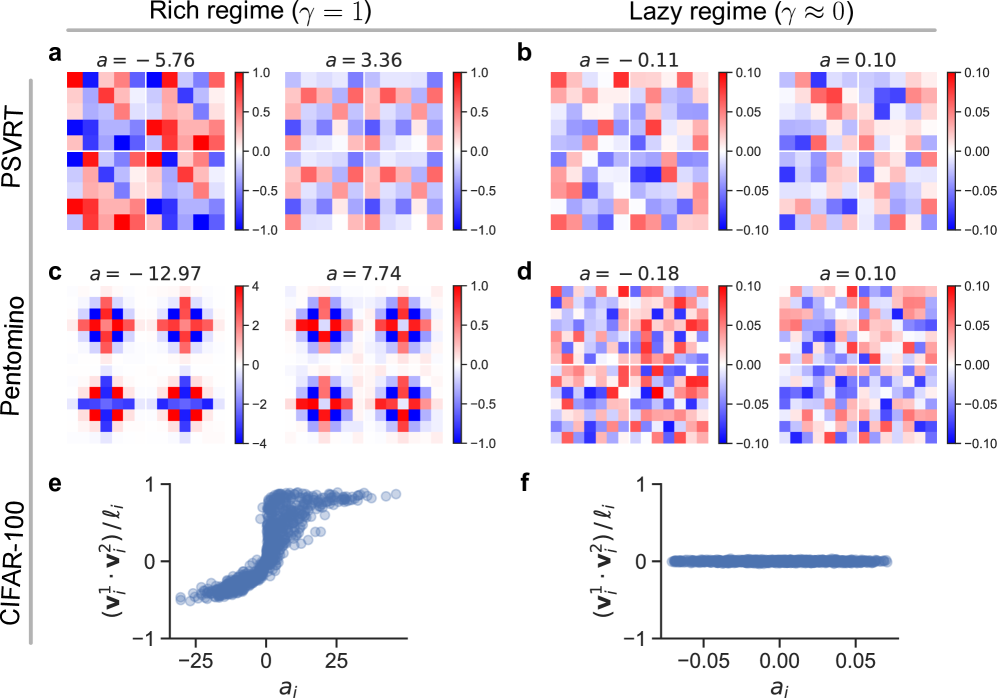
The image presents a multi-panel figure comparing the behavior of different datasets (PSVRT, Pentomino, CIFAR-100) under two regimes: a "Rich regime" (γ = 1) and a "Lazy regime" (γ ≈ 0). The figure consists of heatmaps and scatter plots, each illustrating the relationship between a parameter 'a' and other variables specific to the dataset.
### Components/Axes
* **Overall Structure:** The figure is divided into two main columns representing the "Rich regime" and "Lazy regime." Each row corresponds to a different dataset.
* **Titles:**
* Top-left: "Rich regime (γ = 1)"
* Top-right: "Lazy regime (γ ≈ 0)"
* Left-side labels: "PSVRT", "Pentomino", "CIFAR-100"
* **Heatmaps (PSVRT and Pentomino):**
* Each heatmap is a 2D grid of colored squares.
* Color scale: Ranges from blue to red.
* PSVRT: Blue represents -1.0, red represents 1.0.
* Pentomino: Blue represents -4, red represents 4.
* 'a' values are displayed above each heatmap.
* **Scatter Plots (CIFAR-100):**
* X-axis: "aᵢ" (ranges from approximately -25 to 25 in panel e, and -0.05 to 0.05 in panel f)
* Y-axis: "(vᵢᵀ ⋅ vᵢ²) / lᵢ" (ranges from -1 to 1)
### Detailed Analysis or ### Content Details
**Panel a: PSVRT, Rich Regime, a = -5.76**
* Heatmap: Shows a mix of red and blue squares, indicating both positive and negative values. There is no clear pattern.
* Color scale: Ranges from -1.0 (blue) to 1.0 (red).
**Panel a: PSVRT, Rich Regime, a = 3.36**
* Heatmap: Shows a mix of red and blue squares, indicating both positive and negative values. There is no clear pattern.
* Color scale: Ranges from -1.0 (blue) to 1.0 (red).
**Panel b: PSVRT, Lazy Regime, a = -0.11**
* Heatmap: Shows a mix of red and blue squares, indicating both positive and negative values. The intensity of the colors is less than in the Rich Regime.
* Color scale: Ranges from -0.10 (blue) to 0.10 (red).
**Panel b: PSVRT, Lazy Regime, a = 0.10**
* Heatmap: Shows a mix of red and blue squares, indicating both positive and negative values. The intensity of the colors is less than in the Rich Regime.
* Color scale: Ranges from -0.10 (blue) to 0.10 (red).
**Panel c: Pentomino, Rich Regime, a = -12.97**
* Heatmap: Displays four distinct cross-shaped patterns. The crosses are primarily red in the center and blue on the arms.
* Color scale: Ranges from -4 (blue) to 4 (red).
**Panel c: Pentomino, Rich Regime, a = 7.74**
* Heatmap: Displays four distinct cross-shaped patterns. The crosses are primarily red in the center and blue on the arms.
* Color scale: Ranges from -1.0 (blue) to 1.0 (red).
**Panel d: Pentomino, Lazy Regime, a = -0.18**
* Heatmap: Shows a mix of red and blue squares, indicating both positive and negative values. The intensity of the colors is less than in the Rich Regime.
* Color scale: Ranges from -0.10 (blue) to 0.10 (red).
**Panel d: Pentomino, Lazy Regime, a = 0.10**
* Heatmap: Shows a mix of red and blue squares, indicating both positive and negative values. The intensity of the colors is less than in the Rich Regime.
* Color scale: Ranges from -0.10 (blue) to 0.10 (red).
**Panel e: CIFAR-100, Rich Regime**
* Scatter Plot: Shows a non-linear relationship between "aᵢ" and "(vᵢᵀ ⋅ vᵢ²) / lᵢ".
* For aᵢ < -10, (vᵢᵀ ⋅ vᵢ²) / lᵢ is approximately -0.5.
* As aᵢ increases from -10 to 0, (vᵢᵀ ⋅ vᵢ²) / lᵢ increases sharply from -0.5 to approximately 0.5.
* For aᵢ > 0, (vᵢᵀ ⋅ vᵢ²) / lᵢ gradually increases to approximately 0.8 and then plateaus.
* X-axis: "aᵢ" ranges from approximately -25 to 25.
* Y-axis: "(vᵢᵀ ⋅ vᵢ²) / lᵢ" ranges from -1 to 1.
**Panel f: CIFAR-100, Lazy Regime**
* Scatter Plot: Shows a near-zero relationship between "aᵢ" and "(vᵢᵀ ⋅ vᵢ²) / lᵢ". All points are clustered around 0 on the y-axis.
* X-axis: "aᵢ" ranges from approximately -0.05 to 0.05.
* Y-axis: "(vᵢᵀ ⋅ vᵢ²) / lᵢ" ranges from -1 to 1.
### Key Observations
* The "Rich regime" exhibits more pronounced patterns and wider value ranges compared to the "Lazy regime" for both PSVRT and Pentomino datasets.
* In the "Rich regime," the Pentomino dataset shows distinct cross-shaped patterns, while PSVRT shows a more random distribution.
* For CIFAR-100, the "Rich regime" shows a clear non-linear relationship between "aᵢ" and "(vᵢᵀ ⋅ vᵢ²) / lᵢ", while the "Lazy regime" shows almost no relationship.
### Interpretation
The data suggests that the "Rich regime" (γ = 1) allows for more complex and structured representations within the datasets, as evidenced by the distinct patterns in Pentomino and the non-linear relationship in CIFAR-100. In contrast, the "Lazy regime" (γ ≈ 0) leads to a more uniform and less informative representation, with values clustered around zero. This implies that the parameter γ plays a crucial role in enabling the learning of meaningful features and relationships within these datasets. The parameter 'a' seems to be a key factor influencing the behavior of the datasets, with its effect being significantly diminished in the "Lazy regime."