\n
## Heatmaps & Scatter Plots: Regime-Dependent Feature Representations
### Overview
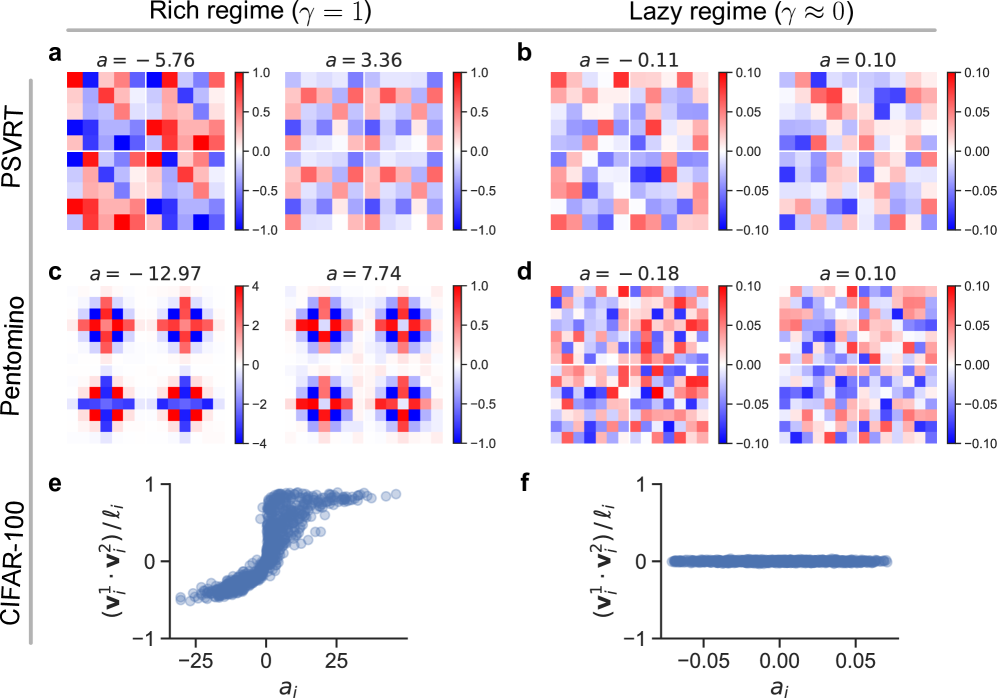
The image presents a series of heatmaps and scatter plots examining feature representations in different regimes (rich vs. lazy). The heatmaps visualize correlation matrices for features extracted from two datasets (PSVRT and Pentomino) under varying parameter 'a'. The scatter plots show the relationship between the variance of feature representations (v<sub>f</sub><sup>2</sup>) and the parameter 'a' for the CIFAR-100 dataset.
### Components/Axes
The image is organized into a 2x3 grid.
* **Top Row (a & b):** PSVRT dataset.
* **a:** Heatmap with α = -5.76, scale from -1.0 to 1.0.
* **b:** Heatmap with α = 3.36, scale from -1.0 to 1.0.
* **Second Row (c & d):** Pentomino dataset.
* **c:** Heatmap with α = -12.97, scale from -4.0 to 4.0.
* **d:** Heatmap with α = 7.74, scale from -1.0 to 1.0.
* **Bottom Row (e & f):** CIFAR-100 dataset.
* **e:** Scatter plot with x-axis labeled 'a<sub>i</sub>' ranging from approximately -25 to 25, and y-axis labeled '(v<sub>f</sub><sup>2</sup>)/μ<sub>i</sub>' ranging from approximately -1 to 1.
* **f:** Scatter plot with x-axis labeled 'a<sub>i</sub>' ranging from approximately -0.05 to 0.05, and y-axis labeled '(v<sub>f</sub><sup>2</sup>)/μ<sub>i</sub>' ranging from approximately -1 to 1.
The image also includes two overarching titles: "Rich regime (γ = 1)" above the left column (a, c, e) and "Lazy regime (γ ≈ 0)" above the right column (b, d, f).
### Detailed Analysis or Content Details
**Heatmaps (PSVRT):**
* **a (α = -5.76):** The heatmap shows strong positive and negative correlations. The color scale ranges from -1.0 (dark blue) to 1.0 (dark red). There are several blocks of strong positive correlation (dark red) and strong negative correlation (dark blue).
* **b (α = 3.36):** The heatmap shows weaker correlations compared to 'a'. The color scale ranges from -1.0 (dark blue) to 1.0 (dark red). The correlations are more diffuse, with less distinct blocks of strong positive or negative correlation.
**Heatmaps (Pentomino):**
* **c (α = -12.97):** This heatmap exhibits the most extreme correlations, with a scale ranging from -4.0 to 4.0. There are large blocks of strong positive and negative correlations.
* **d (α = 7.74):** Similar to the PSVRT heatmap with α = 3.36, this heatmap shows weaker and more diffuse correlations, with a scale ranging from -1.0 to 1.0.
**Scatter Plots (CIFAR-100):**
* **e:** The scatter plot shows a clear trend: as 'a<sub>i</sub>' increases from approximately -25 to 25, (v<sub>f</sub><sup>2</sup>)/μ<sub>i</sub> initially increases rapidly, reaches a peak around a<sub>i</sub> = 20, and then plateaus. The data points are densely clustered, forming a curved shape.
* **f:** The scatter plot shows a much more limited range of 'a<sub>i</sub>' values (approximately -0.05 to 0.05). The data points are scattered around the origin, with a slight upward trend. The variance is much lower than in plot 'e'.
### Key Observations
* The correlation matrices in the "Rich regime" (α < 0) exhibit stronger correlations than those in the "Lazy regime" (α > 0).
* The Pentomino dataset with α = -12.97 shows the most pronounced correlations.
* The CIFAR-100 scatter plot 'e' demonstrates a strong relationship between 'a<sub>i</sub>' and the variance of feature representations, while 'f' shows a much weaker relationship.
* The scale of the heatmaps varies significantly, indicating different magnitudes of correlation in each case.
### Interpretation
The image suggests that the parameter 'a' plays a crucial role in shaping the feature representations learned by the model. In the "Rich regime" (γ = 1), where 'a' is negative, the features are highly correlated, indicating a more structured and potentially redundant representation. The strong correlations in the Pentomino dataset with α = -12.97 suggest that this dataset is particularly sensitive to the value of 'a'.
In the "Lazy regime" (γ ≈ 0), where 'a' is positive, the features are less correlated, indicating a more diverse and potentially less informative representation. The scatter plots for CIFAR-100 further support this interpretation, showing that the variance of feature representations increases with 'a' in the rich regime but remains low in the lazy regime.
The difference in the scales of the heatmaps highlights the varying degrees of correlation across different datasets and parameter values. The outlier in the Pentomino dataset (α = -12.97) suggests that certain datasets may be more susceptible to the effects of the parameter 'a' than others. The plots demonstrate a clear phase transition in the feature representation as the parameter 'a' changes, from a highly structured regime to a more unstructured one.